Hello, dear colleagues!
In yesterday's trading, the euro/dollar currency pair showed truly impressive growth. The beginning of yesterday was quite calm, but then the pair headed in a northerly direction.
The reasons for such confident and powerful growth can always be found. These are the risks that the US economy will plunge into recession, and the speech of ECB President Christine Lagarde, and fears of an escalation of the trade conflict between the US and China.
In my opinion, the main growth factors are technical. If you recall yesterday's review of the main currency pair, there was an emphasis on the higher timeframes: weekly and daily. At these time intervals, a rising scenario was most likely to be seen. Without delaying the matter, it began to become a reality from the first trading day. However, those who adhere to the bullish sentiment on EUR/USD and is in the purchases, do not fall into euphoria. There are still many important and significant events ahead, which will draw a line under the US labor market data, which will be published on December 6 at 14:30 (London time).
Well, it's time to move on to the technical picture for EUR/USD, which has changed.
Daily

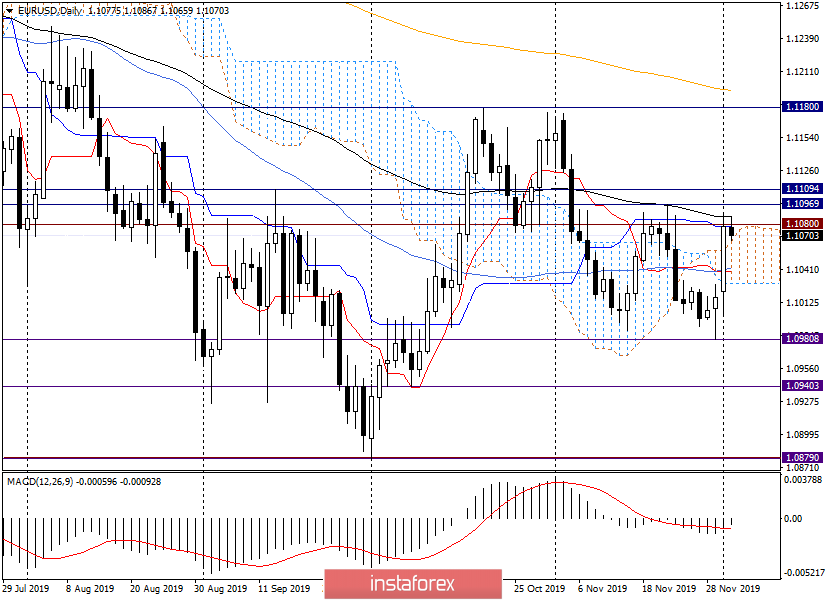
As a result of strong growth, the pair pierced the Tenkan line of the Ichimoku indicator and opened a simple moving average. Characteristically, the growth was again stopped by a significant technical level of 1.1080. Let me remind you that this mark has repeatedly influenced the price dynamics of the main currency pair of the market.
Although the pair confidently went up from the Ichimoku cloud, along with the level of 1.1080, the growth was stopped by the Kijun line and 89 EMA.
At the time of writing, the euro/dollar is already trading slightly above the Kijun and is testing the strength of the 89 exponents. If today's trading ends above 1.1086 (89 EMA), higher targets of 1.1100, 1.1120 and 1.1175 can be expected. Near the last mark, a reversal on the course correction is possible, but in the current situation, the upward scenario looks priority and is likely to continue.
However, it is always necessary to consider an alternative version of the course of trading. If the pair turns in a southerly direction, the most likely and nearest target will be the area of 1.1060-1.1040. Near 1.1040 50 MA and Tenkan can provide good support to the quote and send EUR/USD up again.
H1

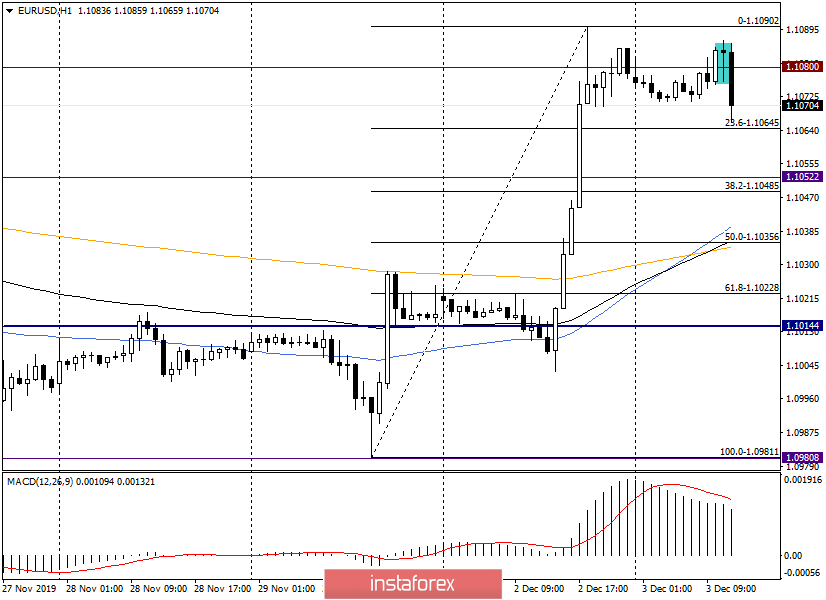
As seen on the hourly chart, I stretched the Fibonacci grid to the growth of 1.0981-1.1090. At this point, a bearish candle appeared, after which the pair decreases. After such a rapid growth, which was observed yesterday, at least some correction is simply necessary.
In my opinion, the opening of long positions looks good on the hourly chart near 1.1040. Here are the 50th Fibo level and moving averages of 50 MA, 89 EMA, and 200 EMA.
It is important that on the daily chart near 1.1040 are 50 MA and Tenkan. Earlier purchases can be tried from 1.1060.
As for sales, for them, in my opinion, it is too late. The pair can turn at any time to continue the rise.
Today's economic calendar is not full of important and significant events, so the course of trading on EUR/USD will be largely determined by technical factors.
Have a nice day!
 English
 Русский
 Bahasa Indonesia
 Bahasa Malay
 ไทย
ไทย Español
 Deutsch
 Български
 Français
 Tiếng Việt
 中文
中文 বাংলা
বাংলা हिन्दी
 Čeština
 Українська
 Română

