GBP/USD
Analysis:
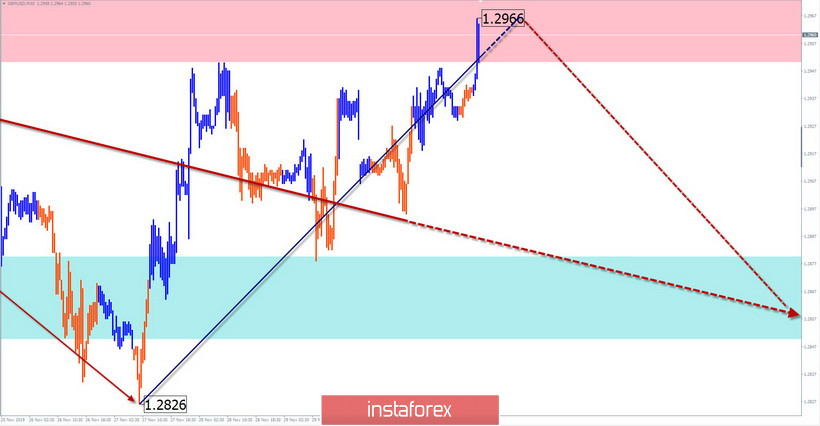
The direction of the pound's short-term trend has been looking up since August. The structure of the wave traces the first 2 parts. The last, unfinished part counts down from November 22. There is a need for correction.
Forecast:
Today, the price is expected to move sideways. Before the reversal, a short-term puncture of the upper resistance boundary is not excluded. The lower limit of the price corridor is settlement support.
Potential reversal zones
Resistance:
- 1.2950/1.2980
Support:
- 1.2880/1.2850
Recommendations:
Refraining from trading on the pair market will be the best tactic for today. Before you start purchasing, you need to wait for the completion of the upcoming rollback down. Sales are possible within the intraday. The lot is better to reduce.

USD/JPY
Analysis:
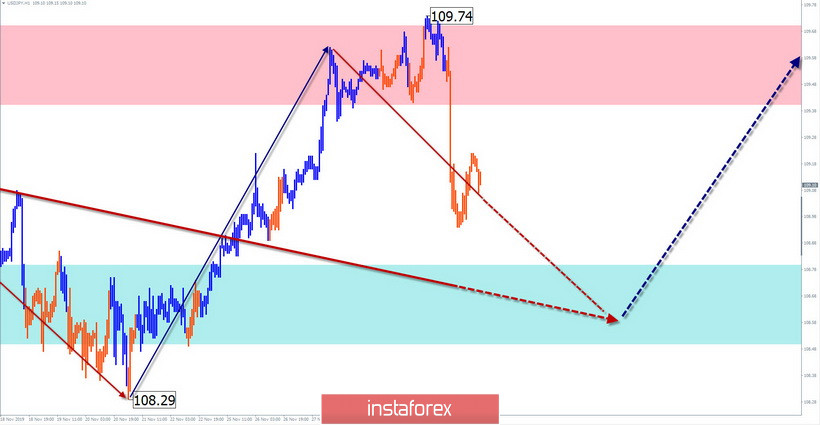
In the dominant bullish wave of the Japanese yen, the final part (C) has been developing since August. It has a pulsed appearance. The last part started on November 1. By the current moment in the wave, the correction section is nearing completion.
Forecast:
Today, it is likely to continue the decline that began yesterday, until its complete completion. Next, the formation of a reversal and the beginning of a price rise is expected.
Potential reversal zones
Resistance:
- 109.40/109.70
Support:
- 108.80/108.50
Recommendations:
Trading on the yen market today is possible only within the sessions. Before the emergence of clear signals of a reversal, sales is the priority. The lot size in such transactions is better to reduce. In the support zone, it is recommended to monitor the signals of buying the pair.

Explanations: In the simplified wave analysis (UVA), waves consist of 3 parts (A-B-C). The last incomplete wave is analyzed. The solid background of the arrows shows the formed structure for determining the expected movement.
Attention: The wave algorithm does not take into account the duration of the tool movements in time!
 English
 Русский
 Bahasa Indonesia
 Bahasa Malay
 ไทย
ไทย Español
 Deutsch
 Български
 Français
 Tiếng Việt
 中文
中文 বাংলা
বাংলা हिन्दी
 Čeština
 Українська
 Română

