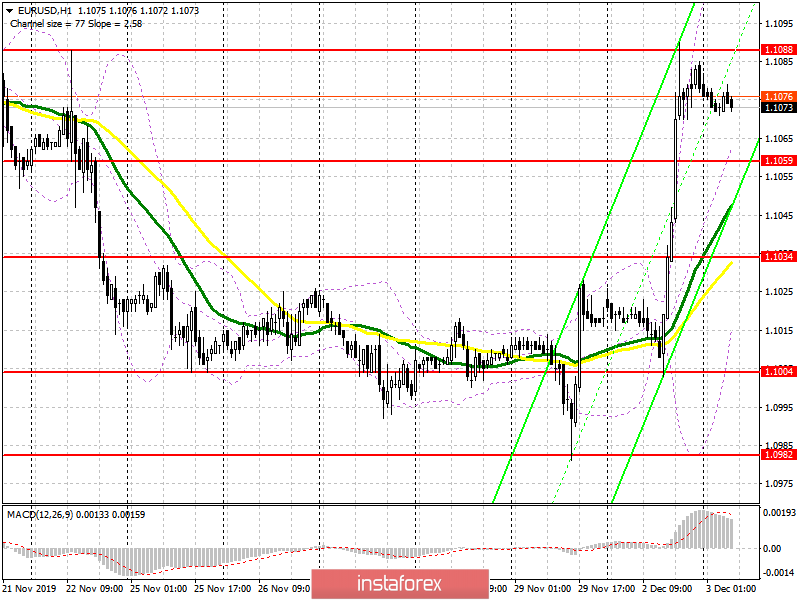
To open long positions on EURUSD you need:
Weak US manufacturing activity reports and new White House administration fees for Argentina and Brazil have weakened the US dollar and lifted the euro. At the moment, the upward correction may continue, however, it is best to open long positions after the formation of a false breakout in the support area of 1.1059, or buy EUR/USD immediately for a rebound from 1.1034. A more important task for the bulls will be to break through and consolidate above the resistance level of 1.1088, however, this will be possible only after a good report on producer prices in the eurozone, which is scheduled for release in the first half of the day. Economists expect prices to remain unchanged in November. A break of 1.1088 will lead to an update of the highs 1.1109 and 1.1131, where I recommend profit taking.
To open short positions on EURUSD you need:
Bears will count on unsuccessful consolidation above the resistance of 1.1088, and updating yesterday's high with divergence forming on the MACD indicator will be the first signal to open short positions in the euro, the purpose of which will be support at 1.1059, but a return to the support level of 1.1034 is more important, which is where I recommend profit taking. It is in the region of 1.1034 that buyers will try to build the lower boundary of the new rising channel. With a EUR/USD growth scenario above the resistance of 1.1088 in the morning after good data on producer prices in the eurozone, it is best to consider short positions after updating the high of 1.1109, or sell immediately for a rebound from the resistance of 1.1131.
Signals of indicators:
Moving averages
Trading is conducted above 30 and 50 moving averages, the test of which, in case of a downward correction, can lead to the formation of a new growth wave.
Bollinger bands
Growth will be limited by the upper level of the indicator in the area of 1.1109, while the lower boundary in the area of 1.1034 will provide support.

Description of indicators
- Moving average (moving average determines the current trend by smoothing out volatility and noise). Period 50. The graph is marked in yellow.
- Moving average (moving average determines the current trend by smoothing out volatility and noise). Period 30. The graph is marked in green.
- MACD indicator (Moving Average Convergence / Divergence - moving average convergence / divergence) Fast EMA period 12. Slow EMA period 26. SMA period 9
- Bollinger Bands (Bollinger Bands). Period 20
 English
 Русский
 Bahasa Indonesia
 Bahasa Malay
 ไทย
ไทย Español
 Deutsch
 Български
 Français
 Tiếng Việt
 中文
中文 বাংলা
বাংলা हिन्दी
 Čeština
 Українська
 Română

