 English
  Русский
 Bahasa Indonesia
 Bahasa Malay
 ไทย
ไทย Español
 Deutsch
 Български
 Français
 Tiếng Việt
 中文
中文 বাংলা
বাংলা हिन्दी
 Čeština
 Українська
 Română

The pair moved down on Wednesday, almost testing the lower fractal which is 1.0990 (red dashed line), but there weren't enough bears for more. Today, the price will try to roll back up, and with a narrow market, this is very likely. Strong Thursday news is not expected on Thursday, plus a day off in the USA.
Trend analysis (Fig. 1).
On Thursday, the price will move up with the first target retreating level of 23.6% equivalent to 1.1018 (blue dotted line). If the price breaks this level, then work up to the retreating level of 38.2% equivalent to 1.1033 (blue dashed line).
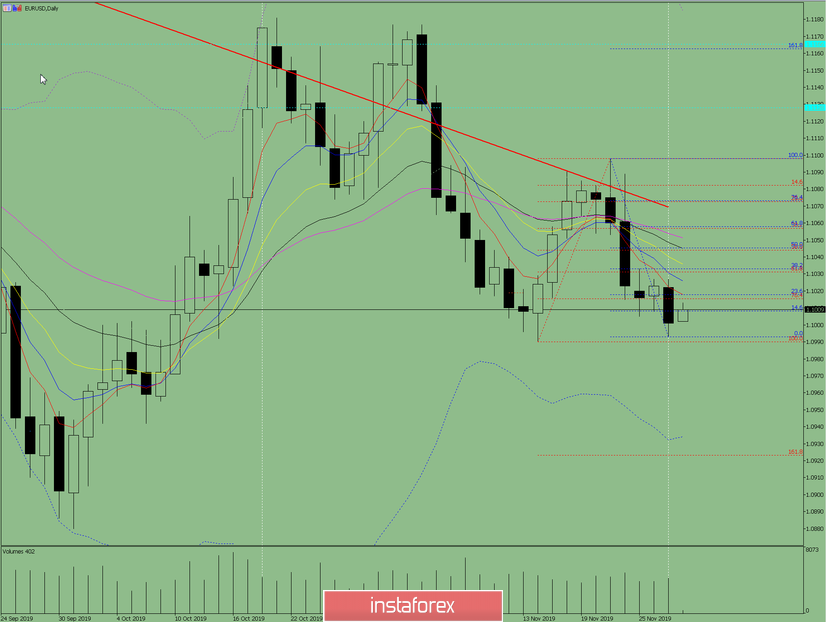
Fig. 1 (daily chart).
Comprehensive analysis:
- Indicator analysis - up;
- Fibonacci levels - up;
- Volumes - up;
- Candlestick analysis - up;
- Trend analysis - neutral;
- Bollinger Lines - down;
- Weekly schedule - up.
General conclusion:
On Thursday, upward movement is possible.
On the first upper target, the pullback level is 23.6% which is equivalent to 1.1018 (blue dashed line). If the price breaks this level, then work up to the retreating level of 38.2% which is equivalent to 1.1033 (blue dashed line).
An unlikely lower scenario is to work down from the retracement level of 14.6.% equivalent to 1.1008 (blue dashed line) with the first target of 1.0990, lower fractal (red dashed line).