GBP/USD
Analysis:
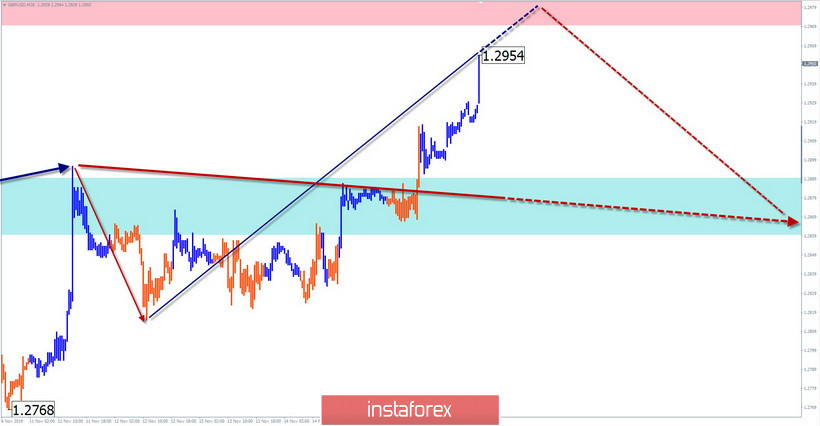
A bullish wave has been forming on the chart of the main pound pair since the beginning of August. The wave is at the end of a larger upward pattern and has a large wave potential. Since the middle of last month, the price forms a correction that has not yet been completed.
Forecast:
Today, the pair price is expected to move between settlement zones. In the first half of the day, the price rise is possible. By the end of the day, it is expected to complete the upward move, the formation of a reversal and the beginning of a decline.
Potential reversal zones
Resistance:
- 1.2970/1.3000
Support:
- 1.2890/1.2860
Recommendations:
Until there are clear signals of completion of the downward correction, trading on the pound market is possible only within the day. Today, sales of the instrument are more relevant. The support zone shows the probable lower limit of the daily rate of the pair.

USD/JPY
Analysis:
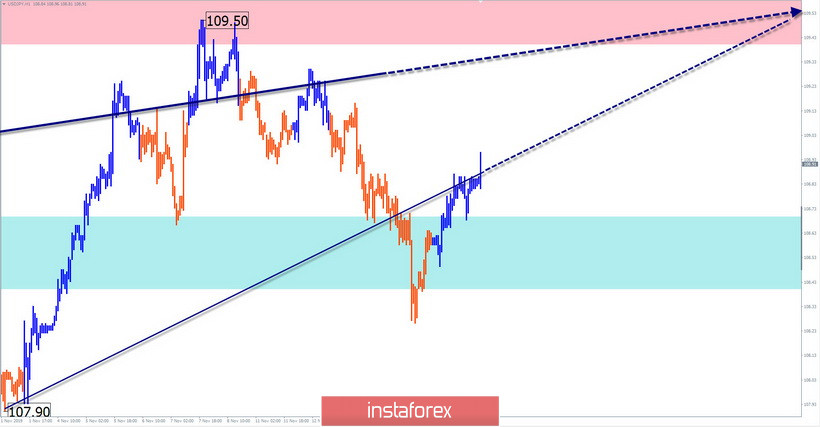
Since the beginning of the year, the formation of an upward trend has continued on the chart of the Japanese yen. The final section started in early August. In the structure of the wave at the end of last week, an intermediate correction was completed. On November 14, a new bullish section started.
Forecast:
Today, the general upward mood of the movement is possible. In the next session, a short-term rollback to the support zone is possible. The active growth phase is expected in the afternoon.
Potential reversal zones
Resistance:
- 109.40/109.70
Support:
- 108.70/108.40
Recommendations:
The pair's sales are high-risk today. It is recommended at the end of all oncoming movements to track the signals of the purchase of the instrument.

Explanations: In the simplified wave analysis (UVA), the waves consist of 3 parts (A-B-C). The last unfinished wave is analyzed. The solid background of the arrows shows the formed structure, dotted – the expected movement.
Attention: The wave algorithm does not take into account the length of time the tool moves!
 English
 Русский
 Bahasa Indonesia
 Bahasa Malay
 ไทย
ไทย Español
 Deutsch
 Български
 Français
 Tiếng Việt
 中文
中文 বাংলা
বাংলা हिन्दी
 Čeština
 Українська
 Română

