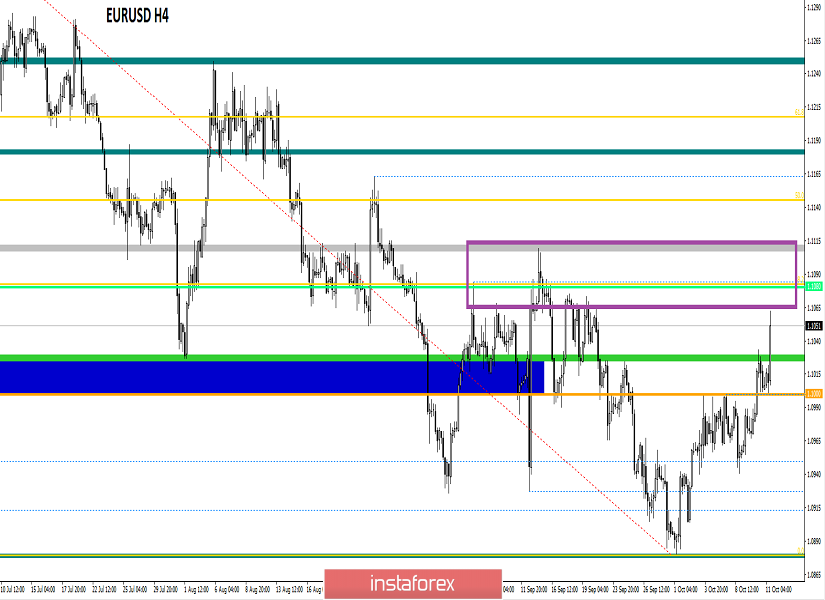
Over the last trading day, the euro/dollar currency pair showed high volatility of 63 points, resulting in a local surge in the market. From technical analysis, we have a resumption of the corrective course towards the possible transformation of the existing phase into an oblong one. We see that the psychological level of 1.1000 fell at the stage of the impulse jump, where the quote locally flew towards the value of 1.1033 and formed a well-known pattern of "Breakdown/Rollback".
Analyzing the past hour by hour, we see an interesting picture that for the second day in a row (October 9-10), there are spikes in prices in the morning. So, October 10 was no exception, and almost in the same period 9:00-12:00 (time on the trading terminal), there was lumbago, which set us volatility for the day.
As discussed in the previous review, speculators, and like all traders, knew that the breakdown of the level of 1.1000 can give a further inertial movement, on which the market participants worked.
Looking at the trading chart in general terms (daily period0, we see that the existing correction is trying to evolve into an oblong, dragging us into a longer process of wagging. It is not yet possible to say that the oblong correction has come since there is still no breakdown of the peak (1.1109) of the previous corrective move. The trend change also did not occur, the downward mood remains in the global view.
The news background of the last day had inflation data in the United States, where it was forecast to grow from 1.7% to 1.8%, but as a result, inflation remained at the same level of 1.7%. Data on applications for unemployment benefits were synchronously released, where initial applications decreased by 10 thousand (October), and repeated, on the contrary, increased by 29 thousand (September). The US dollar, in turn, practically did not respond to statistics and was in the recovery phase after a morning surge.
The information background was quite broad, let's analyze it consistently. So, the two-day negotiations of the representatives of the USA and China, where nothing was achieved, were completed. Judging by the final data, the Chinese delegation refused to talk about forced technology transfer, also bypassed the topic of government subsidies, which, according to the administration of US President Donald Trump, give Chinese competitors an unfair advantage. The market reaction to the conflict of the trade war, in particular of the past negotiations, is very twofold; there is no direct evidence that they influenced the morning price spikes on October 9 and 10. We move on and we see that Brexit once again pleases speculators. So, yesterday, there was a meeting of two leaders of Great Britain and Ireland concerning that stumbling block in the form of "Backstop". To everyone's surprise, it was announced that Boris Johnson and Leo Varadkar had agreed that they could see a path leading to a possible agreement. On such loud news, the market went crazy – the pound flew into the sky, almost instantly having a jump in the average of 230 points. The euro/dollar pair reacted skeptically to the news, but this is more of a delayed reaction than a complete disregard because if you look ahead (October 11), there is a reaction to the news.
Today, in terms of the economic calendar, we do not have worthy statistics on Europe and the United States, but in terms of information noise, everything is fine. So, the head of the European Council, Donald Tusk, said that after the meeting between Johnson and Varadkar, there is little chance of reaching an agreement between Britain and the EU on Brexit. Against this background, the euro and the pound continued to move upward, so to speak, the expectation was in the air, since there are no details of the agreement between the prime ministers of Great Britain and Ireland. At the same time, a meeting of Brexit negotiators Michel Barnier (EU) and Steve Barclay (UK) is scheduled today, where the goal is to outline an action plan for the speedy settlement of the adjustable process.

The upcoming trading week in terms of the economic calendar begins quite slowly, but statistics on Europe and the United States will be released from Wednesday, and a meeting of the European Council will start on Thursday, which will certainly raise interest to speculators expressed by market jumps.
The most interesting events displayed below:
On Wednesday, October 16th
EU 12:00 London time – Consumer price index (September)
US 15:30 London time – Volume of retail sales
On Thursday, October 17th
Meeting of the European Council on October 17 and 18
UK 11:30 London time – Retail sales (y/y) (September): Prev 2.7%
US 15:30 London time – Number of construction permits issued (September): Prev 1.425M – Forecast 1.365M
US 15:30 London time – The volume of construction of new houses (September): Prev 1.364M – Forecast 1.320M
US 16:15 London time – The volume of industrial production (September)
On Saturday, October 19th
Emergency meeting in the UK Parliament
Further development
Analyzing the current trading chart, we see that the information background rules the ball and speculative interest drives the single currency towards the subsequent control point of 1.1100. Analyzing the available jump in detail, we see that the main move fell on the period 12:00-14:00 (time on the trading terminal), that is, a comparison with the statement of Donald Tusk.
In turn, speculators are glad to the limit, because, considering the "Breakdown/Rollback" pattern, they also got a push from the information background, making their positions more profitable.
It is likely to assume that impulse jumps against the background of the information flow will persist in the market, where all hope in terms of the stop is within the range of the previous correction of 1.1070/1.1110. The fact that the long positions are already overheated and there are no details of the agreement regarding the recent meeting, further leads to the idea of whether there will be a drain?

Based on the above information, we derive trading recommendations:
- Buy positions are considered quite risky, as it was necessary to enter at the time of execution of the "Breakdown/Rollback" pattern. Now, the fixation of previously received profit is made and we observe the range of 1.1070/1.1110.
- Sell positions are considered in the recovery plan, but whether a resistance point is found is not a fact. Thus, the resistance guide range is 1.1070 / 1.1110, we also analyze possible stops (consolidation) and, of course, monitoring the news feed.
Indicator analysis
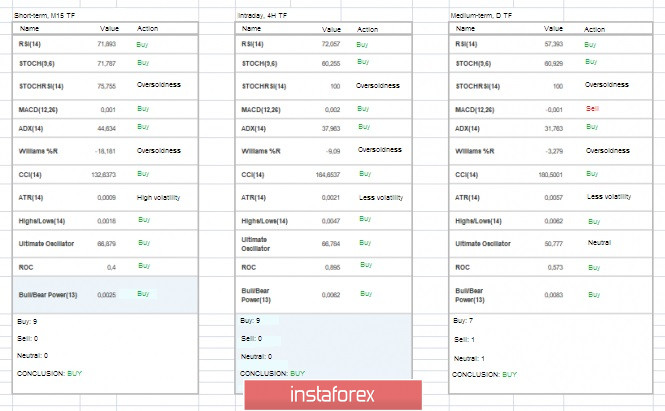
Analyzing the different sectors of timeframes (TF), we see that the indicators on all-time areas signal an upward trend due to impulse jumps in the market. In this case, information noise can harm the indicator analysis, misleading it.

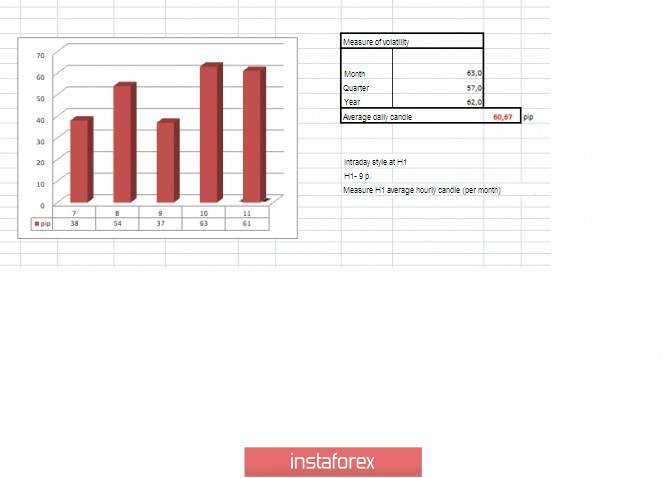
Volatility per week / Measurement of volatility: Month; Quarter; Year.
Measurement of volatility reflects the average daily fluctuation, calculated for the Month / Quarter / Year.
(October 11 was built taking into account the time of publication of the article)
The volatility of the current time is 61 points, which is already equal to the daily average. I do not exclude the possibility that in the case of maintaining information noise, volatility can continue to grow further.

Key levels
Resistance zones: 1.1100**; 1.1180* ; 1.1300**; 1.1450; 1.1550; 1.1650*; 1.1720**; 1.1850**; 1.2100
Support zones: 1.1000***; 1.0900/1.0950**;1.0850**; 1.0500***; 1.0350**; 1.0000***.
* Periodic level
** Range level
*** Psychological level
**** The article is based on the principle of conducting transactions, with daily adjustments.
 English
 Русский
 Bahasa Indonesia
 Bahasa Malay
 ไทย
ไทย Español
 Deutsch
 Български
 Français
 Tiếng Việt
 中文
中文 বাংলা
বাংলা हिन्दी
 Čeština
 Українська
 Română

