To open long positions on GBP/USD you need:
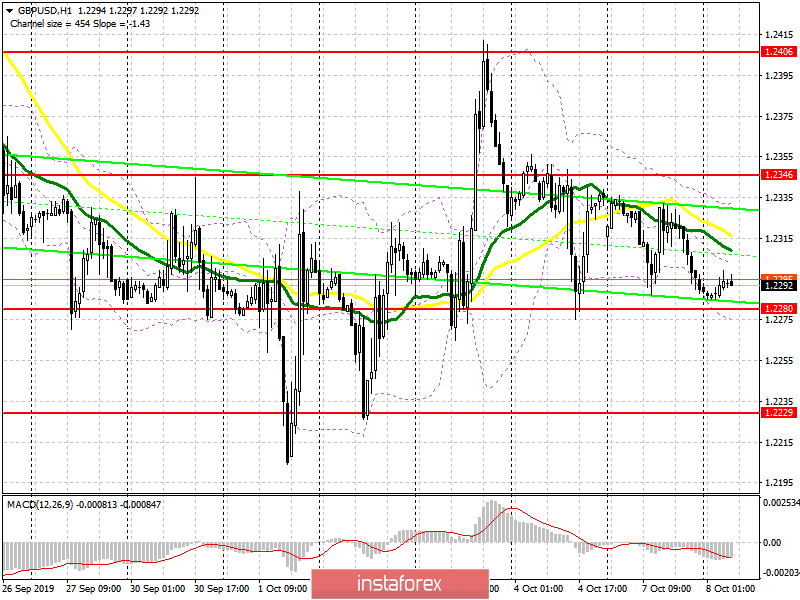
From a technical point of view, nothing has changed. The pair remains hostage to the situation with Brexit, and its further direction depends on the EU's reaction to Boris Johnson's plan. To resume the upward trend, a breakthrough of resistance at 1.2346 is required, since only such a scenario will open the way to the area of last week's high at 1.2406, and then lead to the renewal of resistance at 1.2440 and 1.2479, where I recommend taking profit. Also, an equally important task of the bulls is to maintain the support of 1.2280, since the formation of a false breakdown on it will be the first signal to open long positions in GBP/USD. In a different scenario, buying the pound is best for a rebound from the lows of 1.2229 and 1.2189.
To open short positions on GBP/USD you need:
Yesterday, pound sellers corrected the situation a bit by not letting GBP/USD go above the resistance of 1.2346 yesterday. Negative statements by EU representatives according to the plan of Boris Johnson add to the market nervousness, which puts pressure on the pound. If the pair grows, the bears need to form a false breakout in the resistance area of 1.2346, which will increase the pressure and lead to a test of the low of last Friday at 1.2275. But the further bearish trend depends on the breakthrough of this level, the target of which will be the support areas of 1.2229 and 1.2189, where I recommend taking profit. With the GBP/USD growth scenario above the resistance of 1.2346, it is best to open short positions on a rebound from the high of 1.2406.
Signals of indicators:
Moving averages
Trade is conducted in the region of 30 and 50 moving average, which indicates the lateral nature of the market and uncertainty.
Bollinger bands
A break of the lower boundary of the indicator in the region of 1.2270 will increase pressure on the British pound, while the upper boundary of the indicator in the area of 1.2325 acts as resistance.

Description of indicators
- MA (moving average) 50 days - yellow
- MA (moving average) 30 days - green
- MACD: Fast EMA 12, Slow EMA 26, SMA 9
- Bollinger Bands 20
 English
 Русский
 Bahasa Indonesia
 Bahasa Malay
 ไทย
ไทย Español
 Deutsch
 Български
 Français
 Tiếng Việt
 中文
中文 বাংলা
বাংলা हिन्दी
 Čeština
 Українська
 Română

