4-hour timeframe

Amplitude of the last 5 days (high-low): 85p - 62p - 51p - 72p - 60p.
Average volatility over the past 5 days: 66p (average).
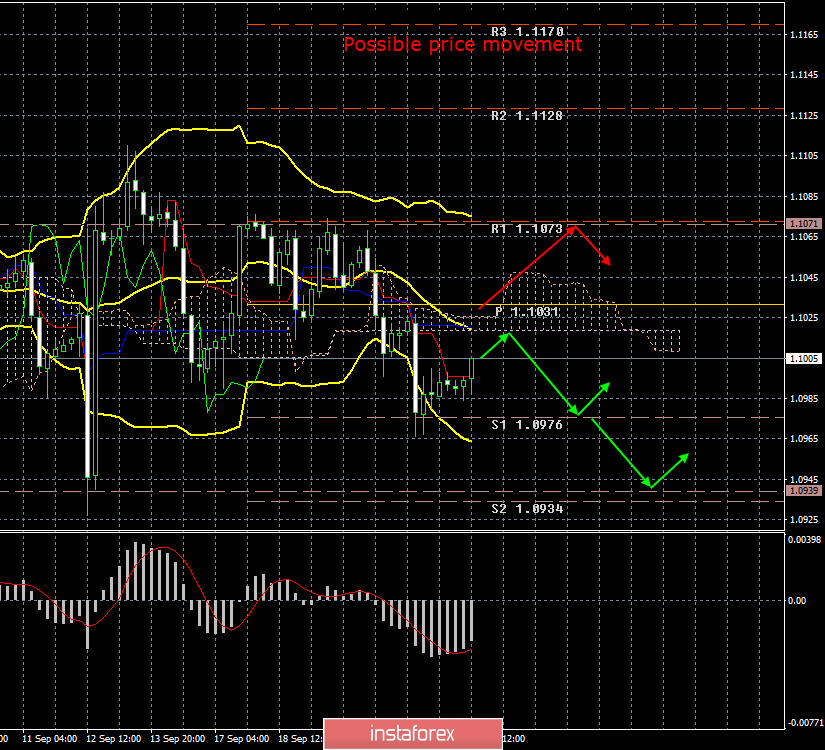
The second trading day of the week for the EUR/USD pair passed in a correctional movement after a rebound from the first support level of 1.0976. Thus, there are still chances that an upward trend will form if the current upward correction develops into a full movement of growth. For this, it is necessary for traders to consolidate the pair above the Ichimoku cloud, which will automatically mean overcoming all the indicator lines. If a rebound follows from the Kijun-sen critical line, then the downward movement is likely to resume. If the downward movement resumes, then we have the right to count on a new test of the level of 1.0926 in the near future, from which the price fought back twice in the past, thus forming a "double bottom" pattern.
From a fundamental point of view, there is practically nothing to say about today. Not a single important macroeconomic report, not a single important speech or interview from senior EU or US officials. All the attention of traders was shifted today towards the GBP/USD pair, according to which there is much more news. As a result, volatility during the day is quite low, only 26 points at the moment, and exclusively corrective mood of traders.

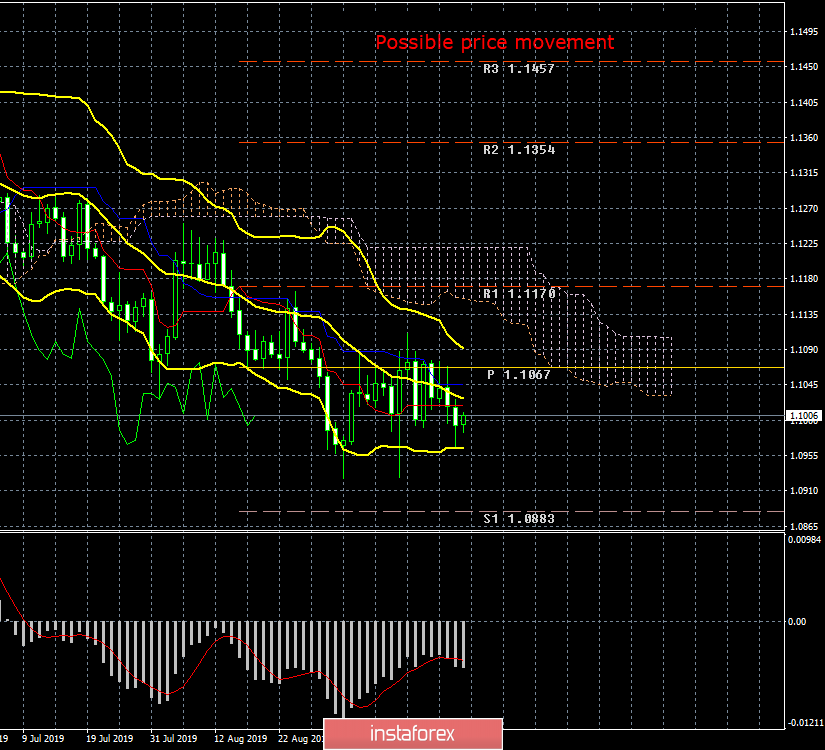
If you look at the lower timeframe, it becomes clear that it is very difficult to pass the area near the level of 1.0950. In fact, the euro/dollar spent the last thirteen trading days between the levels of 1.1000 and 1.1080, that is, in a very narrow price range. At the moment, the Bollinger bands on the 24-hour timeframe are narrowing, which indicates a weakening downward trend in the long term. A more detailed consideration is required in this moment.
If the long-term trend is weakening, then this is the first sign of its completion soon. However, the bulls for the euro/dollar pair remain extremely weak, as the economic situation in the eurozone remains sluggish and continues to deteriorate. Over the past three months, the euro has fallen in price against the dollar by 3-4 cents, this is not a lot, but also not a little. Since the state of the EU economy does not change for the better, and even stabilization is far, we believe that the systematic decline in the European currency will continue. The US economy will now try to "catch up" with the European one. Some signs of a slowdown are also observed in the United States, Jerome Powell announced some risks and threats of a recession, and the Federal Reserve has already lowered its key rate twice. By the way, it is in US rates that it will also try to "catch up" with the European Union, but here the Fed has much more room to maneuver. The current Fed rate is 2.00%. That is, up to zero can be followed by eight more reductions. But with the current interest rate on loans of 0.0% and a deposit rate of -0.50%, it would not accelerate much. Thus, we believe that only as the gap between the rates decreases, will the euro gradually grab the initiative from the US dollar. Not earlier. Adjustments to this hypothesis can be made by a trade war between the United States and the European Union, but since America has not taken official statements and concrete actions, it is too early to talk about it.
Trading recommendations:
The EUR/USD pair continues the upward correction with the target Kijun-sen line. A price rebound from this line could trigger a resumption of the downward movement with targets at 1.0976 and 1.0939. In order for purchase orders to become relevant, it is recommended to wait that the Ichimoku cloud be overcome. In this case, the longs can be considered while aiming for 1.1071.
In addition to the technical picture, fundamental data and the time of their release should also be taken into account.
Explanation of the illustration:
Ichimoku indicator:
Tenkan-sen is the red line.
Kijun-sen is the blue line.
Senkou Span A - light brown dotted line.
Senkou Span B - light purple dashed line.
Chikou Span - green line.
Bollinger Bands Indicator:
3 yellow lines.
MACD indicator:
Red line and bar graph with white bars in the indicator window.
 English
 Русский
 Bahasa Indonesia
 Bahasa Malay
 ไทย
ไทย Español
 Deutsch
 Български
 Français
 Tiếng Việt
 中文
中文 বাংলা
বাংলা हिन्दी
 Čeština
 Українська
 Română

