EUR/USD
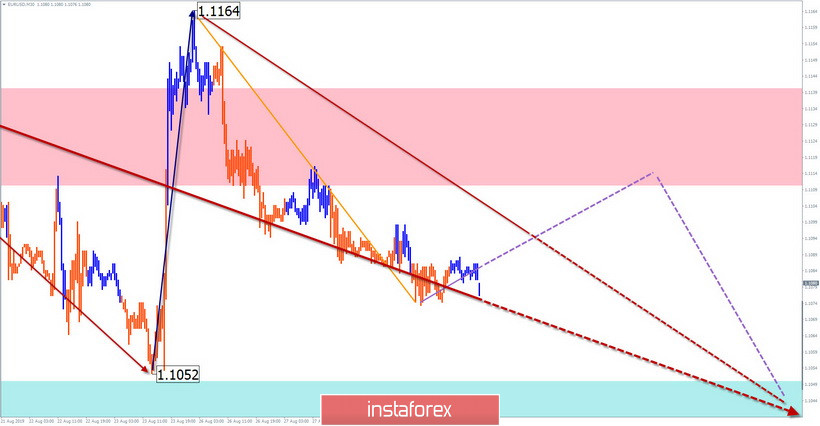
On the euro chart, the main driving model that sets the algorithm of price fluctuations in recent weeks remains the rising wave of August 1. The structure of the correction part of the wave (B) from August 6 shows incompleteness.
Forecast:
In the coming days, it is expected to continue the new round of decline that began on August 26. In the next trading sessions, an upward trend is possible, with the potential to rise no higher than the estimated support. A return to the bearish rate is expected at the end of the day or tomorrow.
Recommendations:
Buying the euro is premature. When the price of the calculated resistance is reached, it is recommended to start tracking the reversal signals for the sale of the instrument.
Resistance zone:
- 1.1110/1.1140
Support zone:
- 1.1050/1.1020

GBP/USD
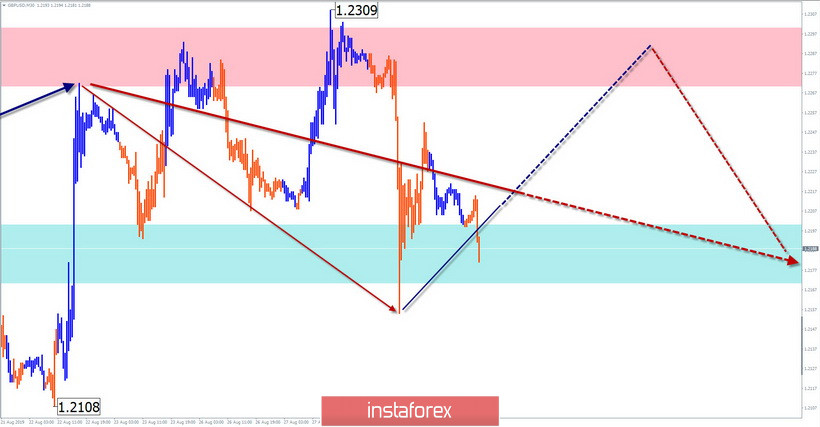
The bearish wave, which began on August 22, forms an "expanding triangle" in its appearance on the chart. The wave is at the end of a bullish correction and has a reversal potential. Quotes of the pair are within a wide area of a potential reversal of a large scale.
Forecast:
There is a high probability of development based on the current wave of the reversal design. In the coming trading sessions, an upward trend in price movement is expected. The upper boundary of the daily volatility of the instrument is the resistance zone.
Recommendations:
Today, the main focus in trade is recommended to make purchases of the pair. Once the resistance zone is reached, it is necessary to start tracking counter signals to search for sell signals.
Resistance zone:
- 1.2270/1.2300
Support zone:
- 1.2200/1.2170

Explanations to figures: Waves in the simplified wave analysis consist of 3 parts (A-B-C). Analyzes the last unfinished wave. Zones show the areas with the highest probability of reversal. Arrows indicate the wave count used by the author to the method, a solid background structure for determining the expected movement.
Attention: The wave algorithm does not take into account the length of time the instrument moves.
 English
 Русский
 Bahasa Indonesia
 Bahasa Malay
 ไทย
ไทย Español
 Deutsch
 Български
 Français
 Tiếng Việt
 中文
中文 বাংলা
বাংলা हिन्दी
 Čeština
 Українська
 Română

