 English
  Русский
 Bahasa Indonesia
 Bahasa Malay
 ไทย
ไทย Español
 Deutsch
 Български
 Français
 Tiếng Việt
 中文
中文 বাংলা
বাংলা हिन्दी
 Čeština
 Українська
 Română

Large TF:
Throughout the past year, the main vector of the movement of the major euro has been the bearish rate. The wave structure does not show completeness. In the last 4 months, the price mainly moves in the "side", forming the middle part (B) of the upward correction.
Small TF:
The rising wave started in November last year as a standard plane. Since January 10, it formed in the middle part of the structure. In the last 2 weeks, there was an intermediate pullback preceding the final pull down.
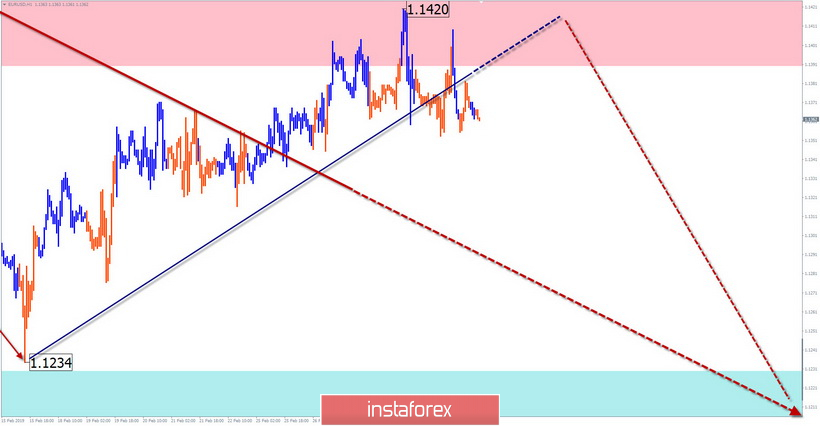
Forecast and recommendations:
Until the correction is completed, entry into the market of the pair can be quite risky. Sales have little potential. After the end of the current decline, t is recommended to pay attention to the buy signals.
Resistance zones:
- 1.1390 / 1.1440
Support areas:
- 1.1230 / 1.1180
Explanations to the figures: The simplified wave analysis uses waves consisting of 3 parts (A – B – C). At each of the considered scales of the graph, the last, incomplete wave is analyzed. Zones show calculated areas with the highest probability of reversal. The arrows indicate the wave marking by the method used by the author with the solid background showing the formed structure, the dotted - the expected movement.
Note: The wave algorithm does not consider the duration of tool movements over time. To conduct a trade transaction, you need confirmation signals from the trading systems you use.