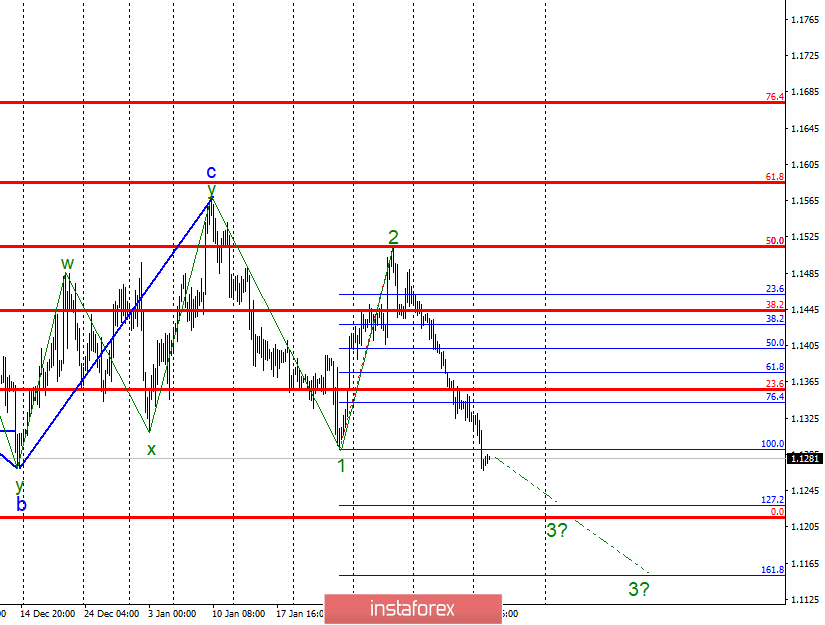
Wave counting analysis:
On Monday, February 11, trading ended for EUR / USD by another 45 bp decline. Thus, the tool performed a successful attempt to break through the level of 100.0% Fibonacci and the minimum of the expected wave 1 of the descending trend section. Thus, the reduction of quotations is now possible with targets near the level of 127.2% and below. So far, there are no prerequisites for the transformation of the current trend segment in the three wave, but still, this option should not be excluded. The 0.0% level on the older Fibonacci grid is the most important for the instrument in the light of the determination of readiness or non-readiness for a strong decline and the construction of 5 waves.
Sales targets:
1.1228 - 127.0% Fibonacci
1.1215 - 0.0% Fibonacci
Shopping goals:
1.1444 - 38.2% Fibonacci
1.1514 - 50.0% Fibonacci
General conclusions and trading recommendations:
The pair continues to build a downward wave 3. Thus, now, I still recommend selling EUR / USD, but be more cautious with targets around 1.1228 and 1.1215, which corresponds to 127.2% and 0, 0% Fibonacci. An unsuccessful attempt to break through one of the target marks can lead not only to the departure of quotes from the lows reached, but also to the completion of the construction of a downward trend segment.
 English
 Русский
 Bahasa Indonesia
 Bahasa Malay
 ไทย
ไทย Español
 Deutsch
 Български
 Français
 Tiếng Việt
 中文
中文 বাংলা
বাংলা हिन्दी
 Čeština
 Українська
 Română

