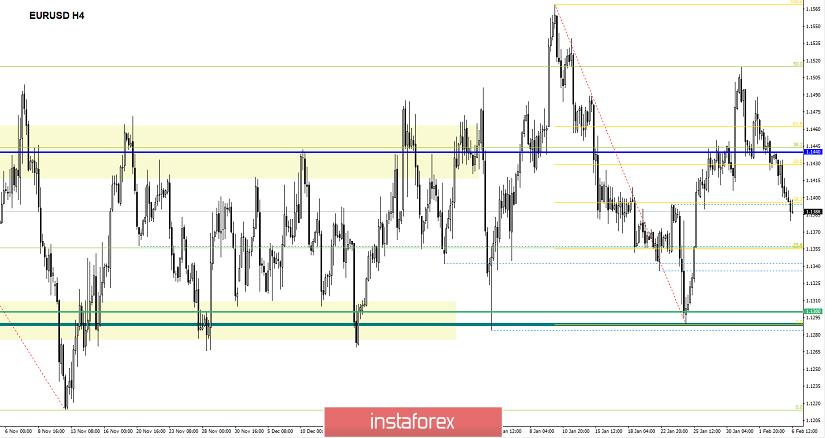
The Euro / Dollar currency pair for the last trading session again showed extremely low volatility of 40 points, but still it should be noted that the downward movement remains unchanged. From the point of view of technical analysis, we see that after the formation of the breakdown-rollback model relative to the level of 1.1440, the downward movement resumed, reaching as a result of the first predicted value of 1.1400. Information and news background continues the cyclical march of the divorce agreement - Brexit. This time we have a rumor from the old woman of England that allegedly on the sidelines of the British government are secretly discussing the postponement of the country's withdrawal from the EU from March 29 to May 24. Naturally, we understand that this is just a rumor, but the fact that there is too little time left before the release is also a fact, therefore a hypothetical date transfer is possible. At the same time, there was news, that British Prime Minister Theresa May will again go to Brussels for talks with Jean-Claude Juncker regarding the Brexit agreement. As we already know from experience, Theresa May's persuasion comes down to one phrase from the EU: "The current agreement is the best agreement of all possible," so what will we hear this time? "The current agreement is ..."

Today, in terms of the economic calendar , we have a package of statistics from the United States:
USA 16:30 Moscow time - Number of building permits issued: Prev. 1,328M ---> Forecast 1,290M
US - Basic orders for durable goods (m / m), the forecast growth of 0.2% (prev.)
US 16:30 Moscow Time - Basic Retail Sales (MoM) Prev. 0.2% ---> Forecast 0.0%
United States - GDP (sq / sq.): Prev. 3.4% ---> Forecast 2.6% (prev.)
United States - Retail Sales (MoM): Prev. 0.2% ---> Forecast 0.1% (prev.)
Further development
Analyzing the current trading chart, we see that the quote retains downward interest, already fixing below the value of 1.1400. It is likely to assume that the current mood will continue, where traders are focused on the move to 1.1350.

Based on the available data, it is possible to decompose a number of variations, let's consider them:
- Buy positions are considered in the case of a rollback phase, where the price is fixed higher than 1.1400.
- Positions for sale, as he wrote in the previous review, traders are focused on fixing prices lower than 1.1440, which actually happened.
Landmarks - 1.1400 (isp.). the second point is 1,350.
Indicator Analysis
Analyzing a different sector of timeframes (TF ), we see that in the short, intraday and medium term prospects there is a downward interest against the general background of the market.
Weekly volatility / Measurement of volatility: Month; Quarter; Year
Measurement of volatility reflects the average daily fluctuation , with the calculation for the Month / Quarter / Year.
(February 6 was based on the time of publication of the article)
The current time volatility is 29 points. It is likely to assume that volatility will remain within the framework of the average daily indicator, until the moment of exhaust from the information background.
Key levels
Zones of resistance: 1.1440; 1.1550; 1.1650 *; 1.1720 **; 1.1850 **; 1.2100
Support areas: 1.1350 *; 1,1300 **; 1.1214 **; 1.1120; 1.1000
* Periodic level
** Range Level
 English
 Русский
 Bahasa Indonesia
 Bahasa Malay
 ไทย
ไทย Español
 Deutsch
 Български
 Français
 Tiếng Việt
 中文
中文 বাংলা
বাংলা हिन्दी
 Čeština
 Українська
 Română

