 English
  Русский
 Bahasa Indonesia
 Bahasa Malay
 ไทย
ไทย Español
 Deutsch
 Български
 Français
 Tiếng Việt
 中文
中文 বাংলা
বাংলা हिन्दी
 Čeština
 Українська
 Română

To open long positions on GBP/USD you need:
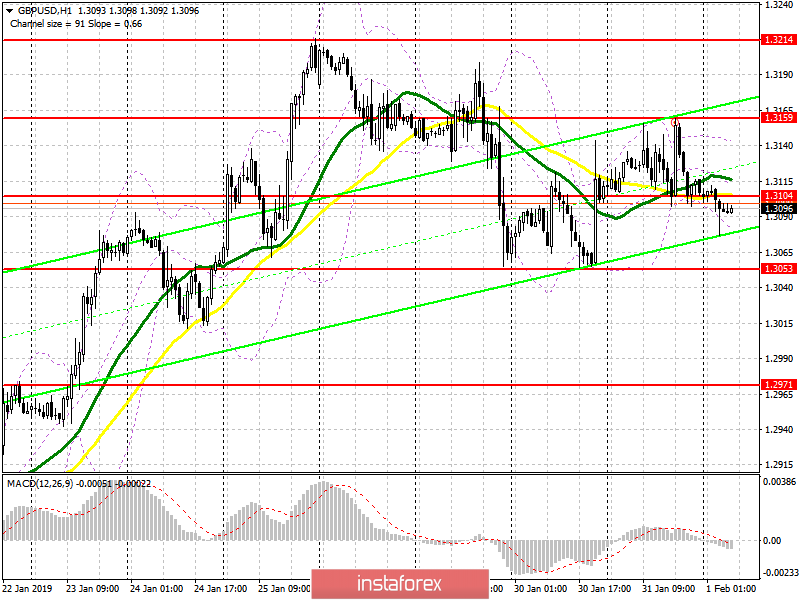
Buyers of the British pound may resume an uptrend, but this will require a breakdown of the middle of the channel in the area of 1.3104, with a fixation above the resistance of 1.3159. Only after this will the prospect of updating the highs in the region of 1.3214 and 1.3260 open, where I recommend taking profits. However, a larger upward movement will depend on negotiations between British Prime Minister Theresa May and EU representatives. In case of a downward correction, I recommend buying the pound only if there is a false breakdown around 1.3053 or for a rebound from 1.2971.
To open short positions on GBP/USD you need:
An unfortunate consolidation above the resistance of 1.3104 will be the first signal to sell the British pound, however, the main goal of the sellers will be a breakthrough of support at 1.3053, which could lead to a further drop in GBP/USD with a low of 1.2971 and 1.2894, where I recommend taking profits. In case the pound rises above 1.3104, it's best to take a closer look at short positions after updating the high in the area of 1.3159 or at a rebound from the level of 1.3214. Any news of the failure of negotiations between May and EU representatives could lead to a rapid fall in the pound.
Indicator signals:
Moving averages
Trade is conducted in the area of 30-day and 50-day moving, which indicates the formation of the lateral nature of the market.
Bollinger bands
Volatility is low, which does not give signals for entering the market using the Bollinger Bands indicator.
Description of indicators
- MA (moving average) 50 days - yellow
- MA (moving average) 30 days - green
- MACD: fast EMA 12, slow EMA 26, SMA 9
- Bollinger Bands 20