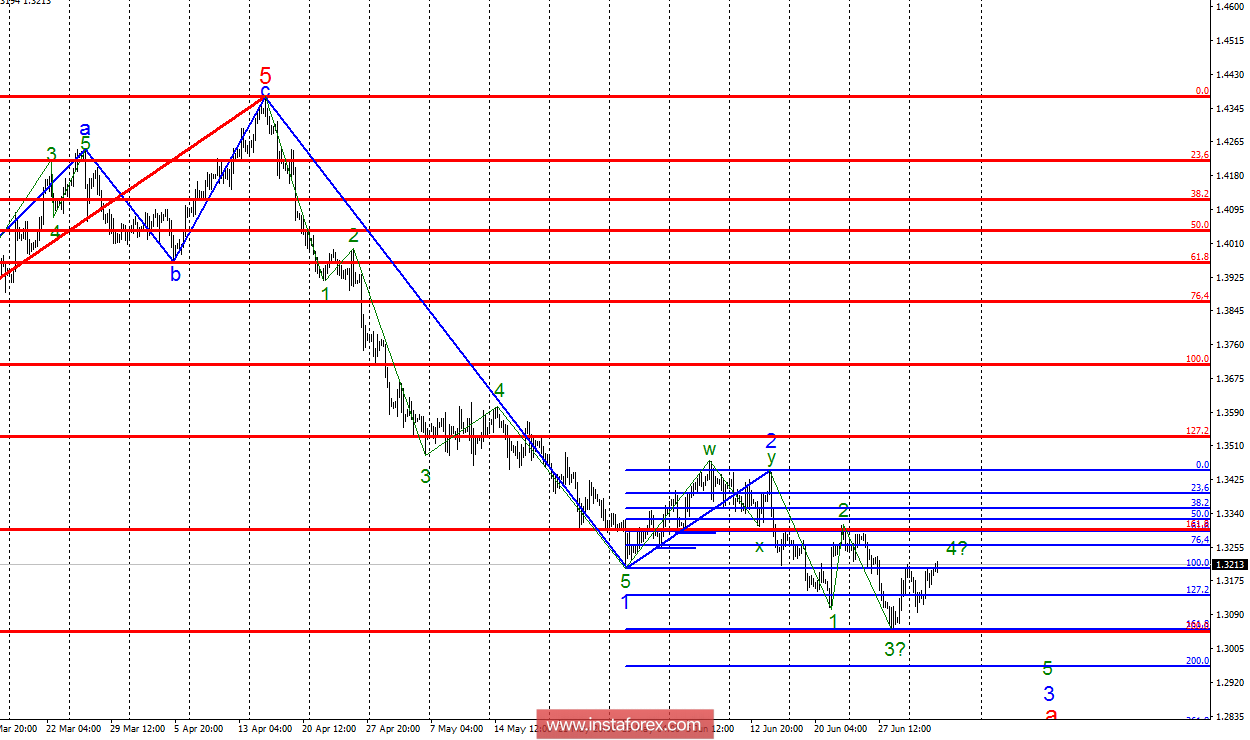
Analysis of wave counting:
In the course of trades on July 3, the GBP/USD pair increased by 50 basis points, which leads to the complication of the proposed wave 4, at 3, in the downtrend and the whole wave 3, in a, which began to take the form of a diagonal triangle. If this assumption is correct, the decline in quotes will nevertheless resume within wave 5 with targets around 1.3054 and 1.2962. After this, it is possible to complete the construction of the descending section of the trend and refine the wave counting. Anyway, now is expected to decline quotes. The working variant retains a high probability of execution until the maximum of wave 2, at 3, in a is broken through.
Targets for buying:
1.3445 - 0.0% Fibonacci (formal goal)
Targets for selling:
1.3054 - 161.8% by Fibonacci
1.2962 - 200,0% by Fibonacci
1.2809 - 261.8% by Fibonacci
General conclusions and trading recommendations:
The GBP/USD pair continues to rise in quotes, presumably within wave 4, at 3, in a. If this is the case, then in today's decline the pair may resume within wave 5 with targets located near the markers 1.3054 and 1.2962, which corresponds to 161.8% and 200.0% by Fibonacci. Return to buying of the pair is recommended not before the cancellation of the current work plan, that is, after a successful attempt to break through the 161.8% mark on the senior Fibonacci grid.
 English
 Русский
 Bahasa Indonesia
 Bahasa Malay
 ไทย
ไทย Español
 Deutsch
 Български
 Français
 Tiếng Việt
 中文
中文 বাংলা
বাংলা हिन्दी
 Čeština
 Українська
 Română

