EUR/JPY
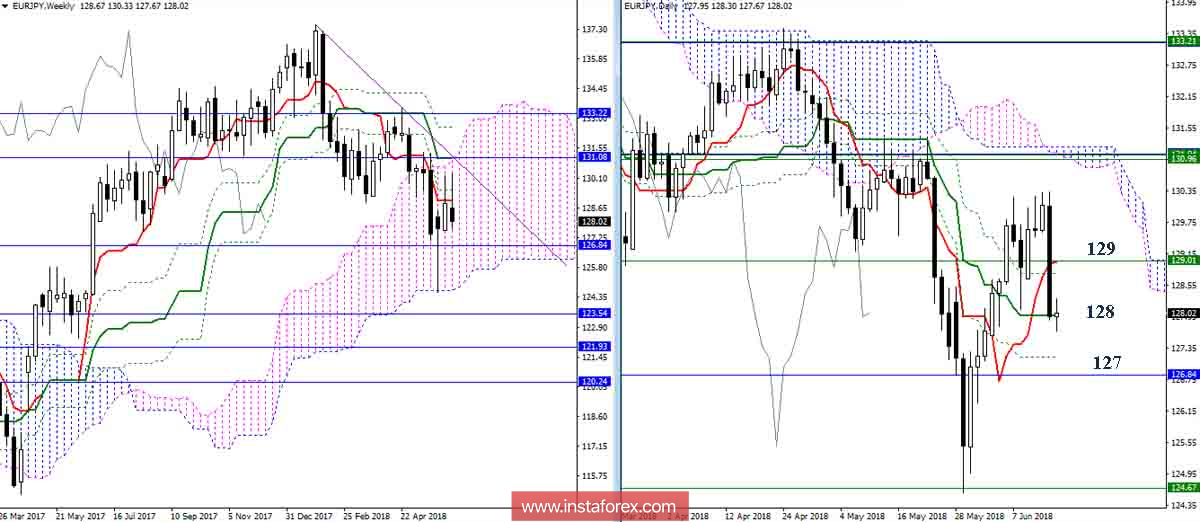
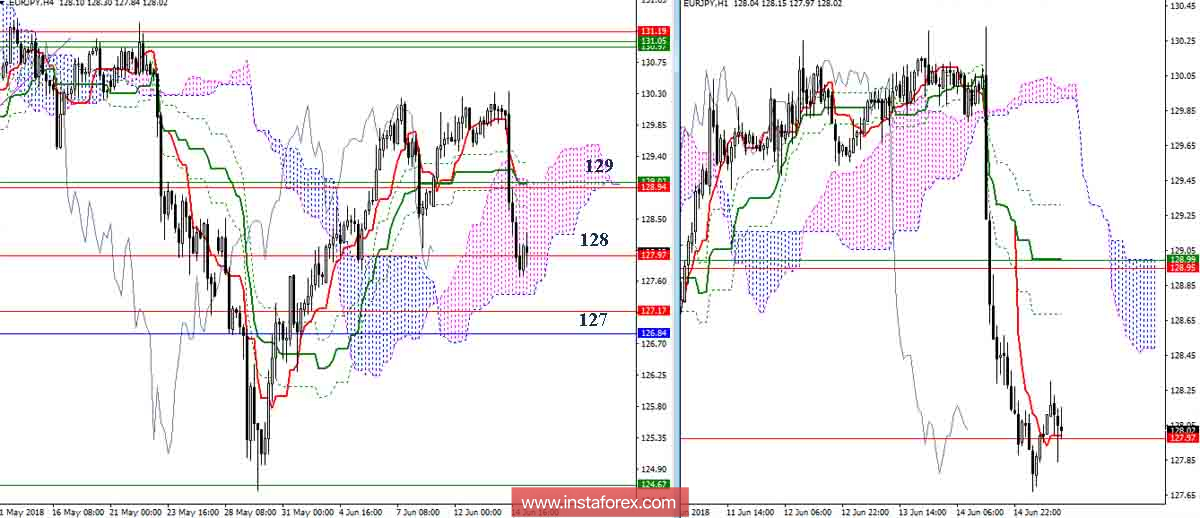
Weakness of players to increase by the end of the week has indeed led to a corrective decline, which was executed quite actively and effectively. To date, support has been reached for 128 (daily Kijun). This support (128) is a kind of equilibrium point, so it can have an attraction and contribute to a longer braking. An important zone of resistance now stands in the area of 129, here the levels of junior and senior times have merged. The consolidation above will contribute to the emergence of some prospects for the recovery of bullish benefits. The breakdown of the H4 cloud and supports (daily Fibo Kijun + monthly Fibo Kijun) in the 127 area will lead to the emergence of new downward benchmarks.

Indicator parameters:
all time intervals 9 - 26 - 52
Color of indicator lines:
Tenkan (short-term trend) - red,
Kijun (medium-term trend) - green,
Fibo Kijun is a green dotted line,
Chinkou is gray,
clouds: Senkou Span B (SSB, long-term trend) - blue,
Senkou Span A (SSA) - pink.
Color of additional lines:
support and resistance MN - blue, W1 - green, D1 - red, H4 - pink, H1 - gray,
horizontal levels (not Ichimoku) - brown,
trend lines - purple.
 English
 Русский
 Bahasa Indonesia
 Bahasa Malay
 ไทย
ไทย Español
 Deutsch
 Български
 Français
 Tiếng Việt
 中文
中文 বাংলা
বাংলা हिन्दी
 Čeština
 Українська
 Română

