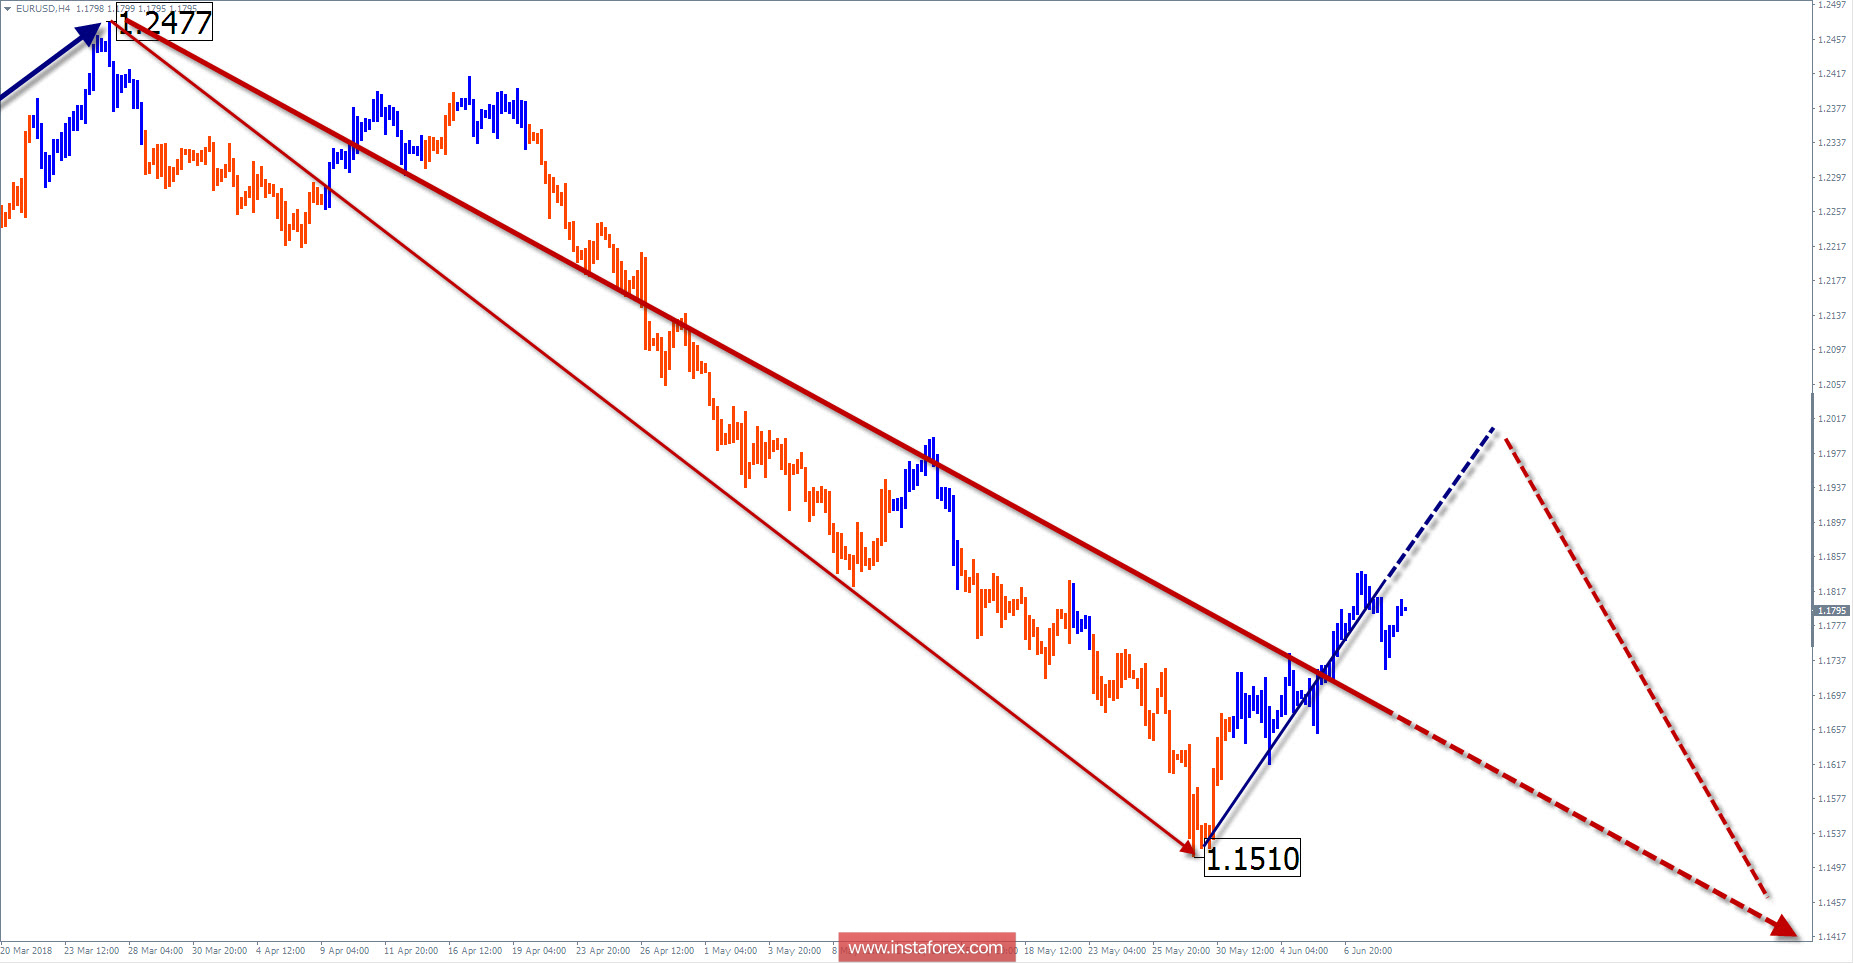
Wave picture of the chart H4:
On the chart of the Euro major since mid-February, the trend direction is set by the downward wave. In a large wave model, it takes the place of correction. The wave structure is still not fully formed.

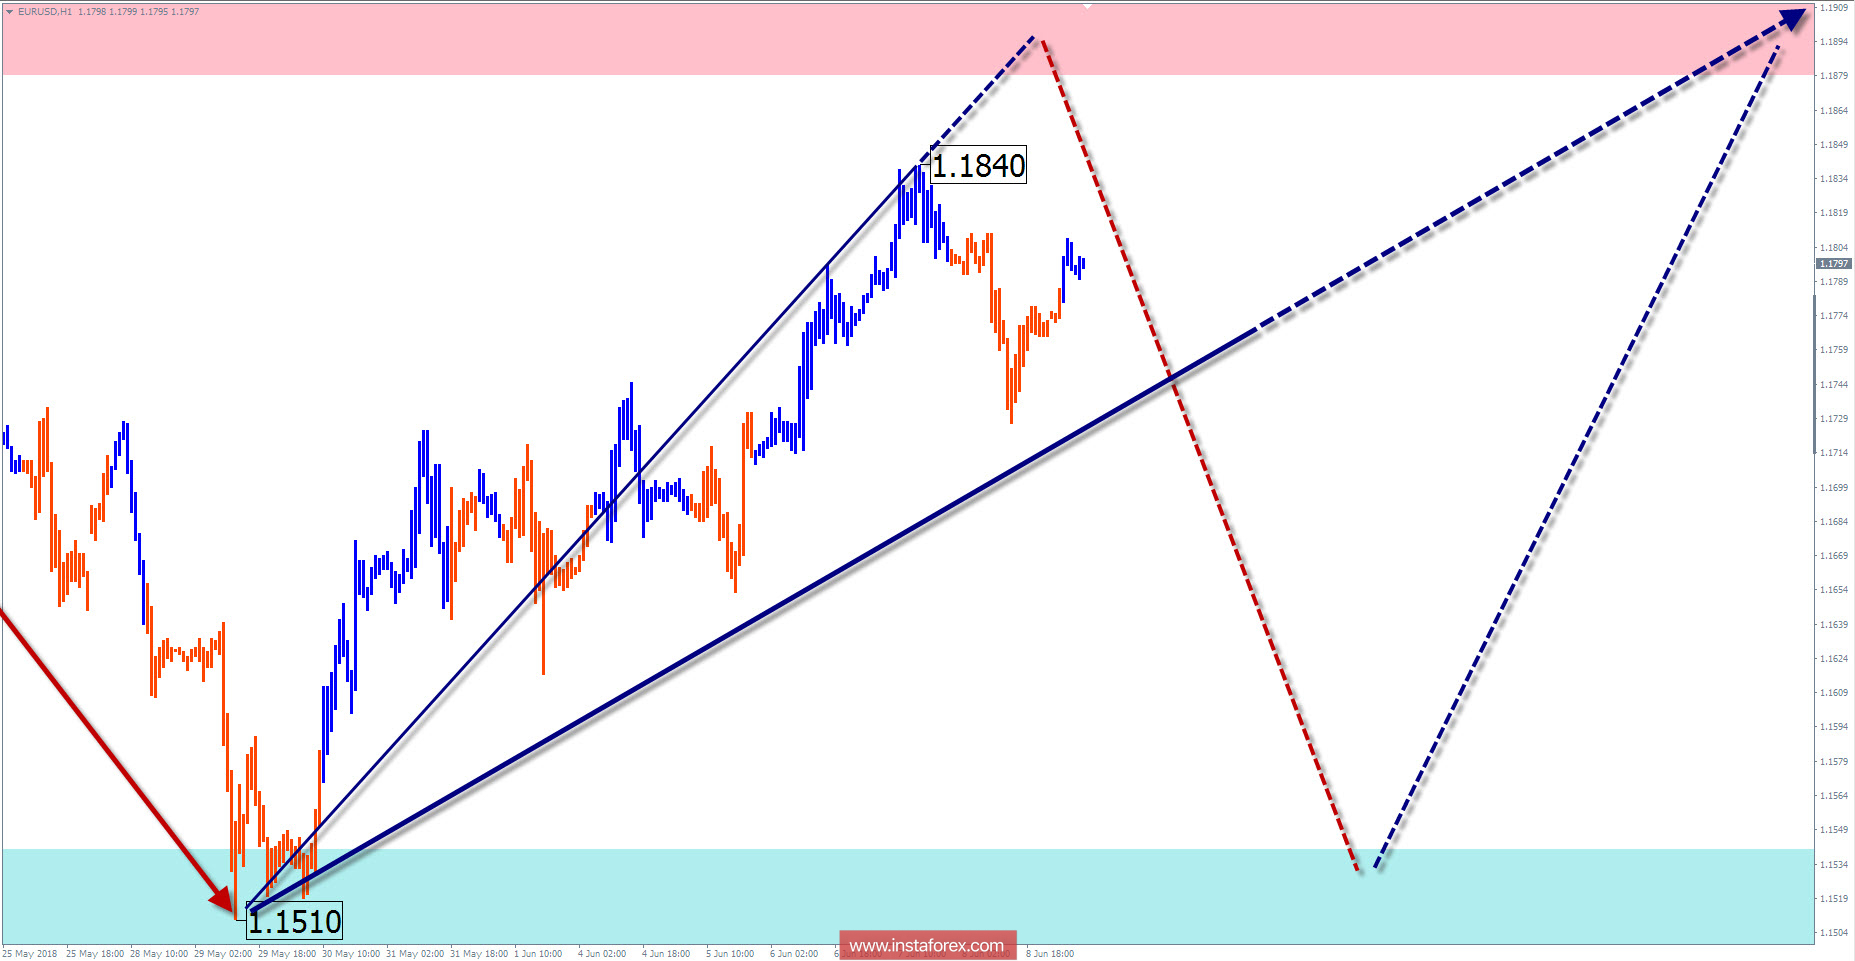
The wave pattern of the graph H1:
The unfinished wave for today from the end of March, in a larger design became the final part (C). The quotes reached the upper limit of the intermediate support zone.
The wave pattern of the M15 chart:
The upward section of May 29 started after the price contact with the upper boundary of a large-scale zone. The potential of this section exceeds the level of rollback. The probability of continuation is high, with the formation of a full correction of the previous wave.

Recommended trading strategy:
A supporter of trading on a large scale of the chart must wait for the completion of the entire bearish wave. It is necessary for those trading TF below M15 to wait for the buy signals, after the completion of the upcoming rollback.
Resistance zones:
- 1.1880/1.1930
Support zones:
- 1.1540/1.1490
Figure explanations: Simplified wave analysis uses a simple 3-part waveform (A-B-C). On each TF, the last, unfinished wave is analyzed. The zones demonstrate the calculated areas with the highest probability of reversal.
The arrows indicate the wave marking according to the method used by the author. The solid background shows the generated structure, dotted - the expected wave motion.
Attention: The wave algorithm does not take into account the duration of the trading instrument's movements in time. To conduct a trade transaction, you need confirmation signals from your trading systems!
 English
 Русский
 Bahasa Indonesia
 Bahasa Malay
 ไทย
ไทย Español
 Deutsch
 Български
 Français
 Tiếng Việt
 中文
中文 বাংলা
বাংলা हिन्दी
 Čeština
 Українська
 Română

