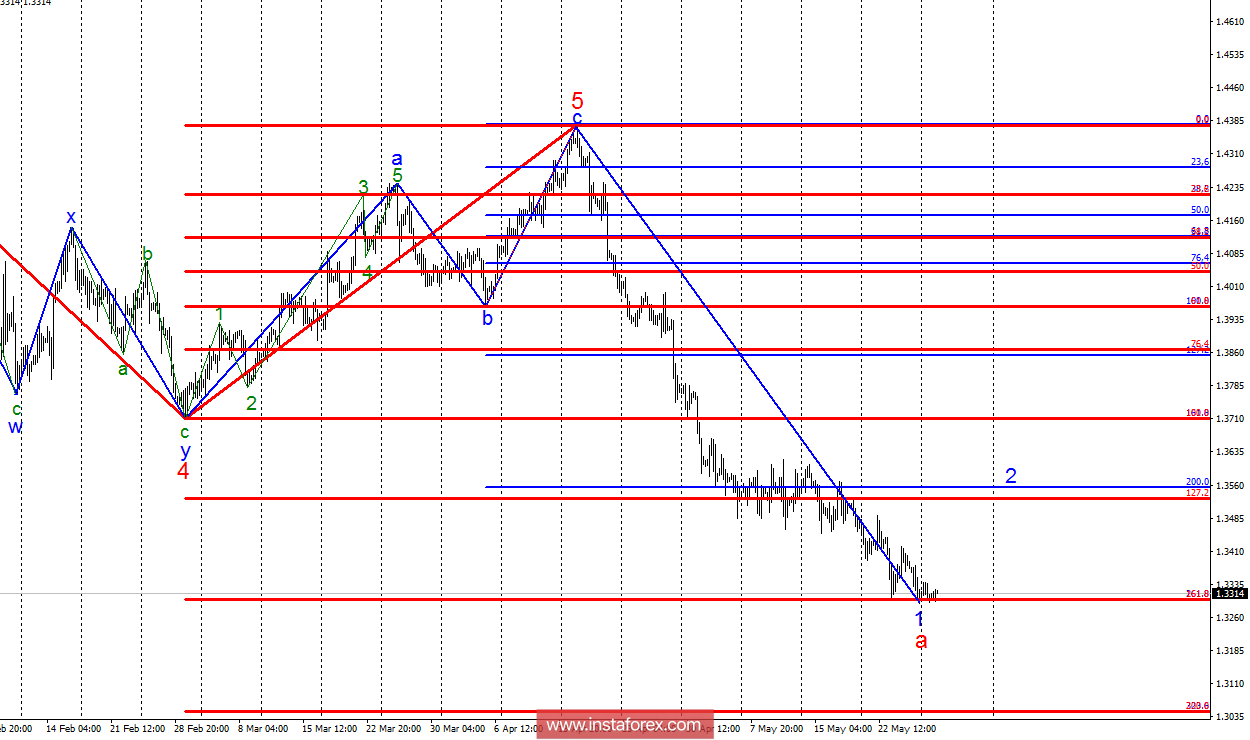
Analysis of wave counting:
During the trading on May 28, the GBP / USD currency pair found no reason to break through the 33rd figure, which is also the Fibonacci level of 261.8%. However, for the construction of the first waves in the future wave 2, the pair also finds no reasons. The trading went in a narrow range and with an amplitude of not more than 25 points. Thus, the pair still retains a good chance of making the entire wave 1 more complicated, but with goals just above the 30th figure. At the same time, there are no visible obstacles to the long-awaited construction of a correctional wave 2 with targets between 35 and 36 figures.
The objectives for the option with purchases:
1.3528 - 127.2% of the Fibonacci of the highest order
1.3555 - 200.0% of Fibonacci
The objectives for the option with sales:
1.3300 - 161.8% of the Fibonacci of the highest order
1.3300 - 261.8% of Fibonacci
1.3045 - 200.0% of the Fibonacci of the highest order
General conclusions and trading recommendations:
The instrument continues to attempt to complete the construction of wave 1, a. Near the 1.3300 mark, I still recommend fixing the profits, and new sales should be started if a successful breakthrough of the 33rd figures is successful. The targets for the complicated wave 1 are located near the calculated mark of 1.3045, which corresponds to 200.0% of the Fibonacci, built from the wave 5. I recommend buying the pair very carefully and with Stop Loss at a minimum of wave 1, a, since I expect the beginning the construction of wave 2 in the near future.
 English
 Русский
 Bahasa Indonesia
 Bahasa Malay
 ไทย
ไทย Español
 Deutsch
 Български
 Français
 Tiếng Việt
 中文
中文 বাংলা
বাংলা हिन्दी
 Čeština
 Українська
 Română

