AUD / USD
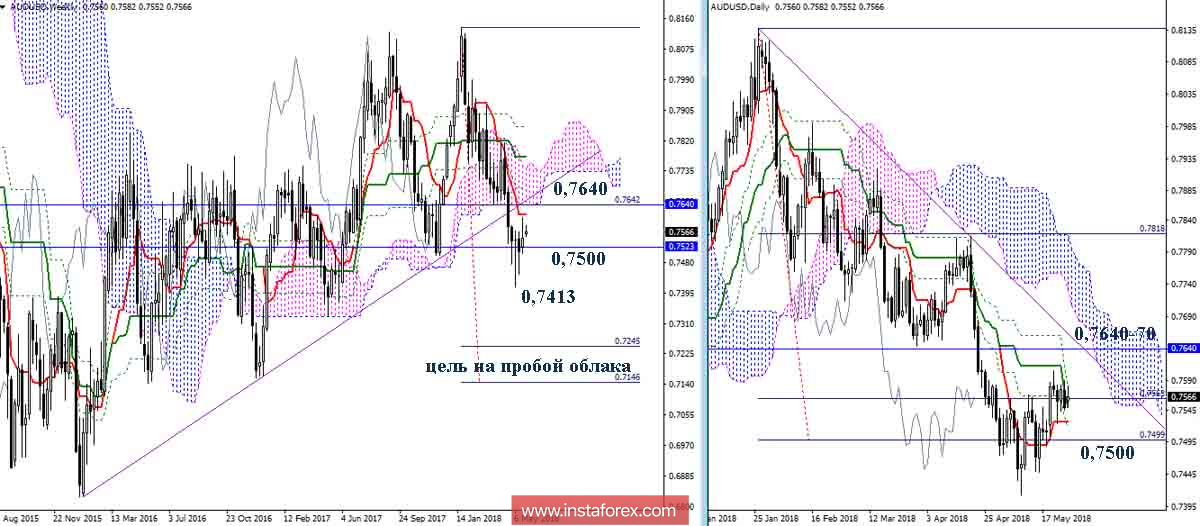
The deceleration and ascending correction caused by the meeting with the final support of the monthly gold cross and working out the daily target for the breakdown of the cloud (0.7499) continue to develop. To date, the pair is close to the complete elimination of the day-long dead cross Ichimoku. If the cross goes into the category of support, then for players to increase there will be new opportunities for recovery, with the daily cloud becoming the main upward direction. On the way to the cloud, it should be noted resistance of 0.7640 (monthly Kijun + week Senkou Span B).
In the case of a breakdown of the supports (0.7500 area) and completion of the upward correction (the minimum extremum is 0.7413), the priority for the players on the downgrade will be the execution of the weekly target at the breakdown of the cloud (0.7146-0.7245).
Indicator parameters:
All time intervals 9 - 26 - 52
The color of indicator lines:
Tenkan (short-term trend) - red,
Kijun (medium-term trend) - green,
Fibo Kijun is a green dotted line,
Chinkou is gray,
Clouds: Senkou Span B (SSB, long-term trend) - blue,
Senkou Span A (SSA) - pink.
The color of additional lines:
Support and resistance MN - blue, W1 - green, D1 - red, H4 - pink, H1 - gray,
Horizontal levels (not Ichimoku) - brown,
Trend lines - purple.
 English
 Русский
 Bahasa Indonesia
 Bahasa Malay
 ไทย
ไทย Español
 Deutsch
 Български
 Français
 Tiếng Việt
 中文
中文 বাংলা
বাংলা हिन्दी
 Čeština
 Українська
 Română

