USD / JPY
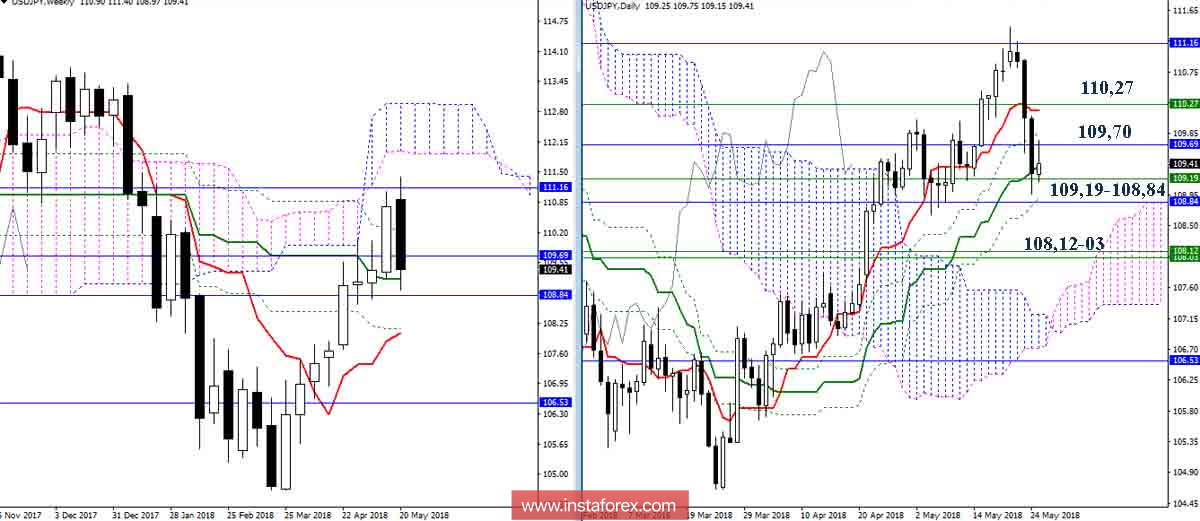
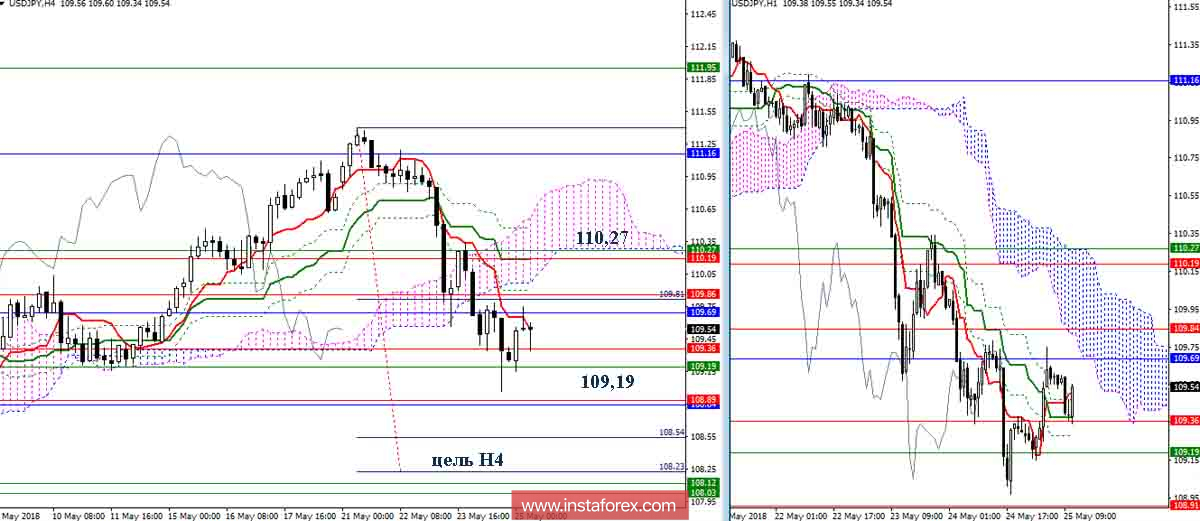
Earlier, the productive upward movement came across the resistance of the monthly Fibo Kijun (111.16). This circumstance allowed players to lower the mood to change the market. To date, the pair is close to closing the current week by forming a candle model of absorption (bearish). The closing of the week below the current supports 109.19 - 108.84 (weekly Kijun + day Fibo Kijun + month Kijun) is able to significantly influence the further development of the situation and open up new prospects for players. The nearest support, in this case, is located around 108.12-03 (week Tenkan + Fibo Kijun). Long braking can now cause some recovery in bullish positions. The main guide for the rise will be resistance 110,27 (day Tenkan + weekly Fibo Kijun + Senkou Span B N4). The breakdown of this resistance and reliable consolidation above will cancel some downward benchmarks, including the goal for the breakdown of the H4 cloud, as a result of which a new assessment of the situation will be required.

Indicator parameters:
All time intervals 9 - 26 - 52
The color of indicator lines:
Tenkan (short-term trend) - red,
Kijun (medium-term trend) - green,
Fibo Kijun is a green dotted line,
Chinkou is gray,
Clouds: Senkou Span B (SSB, long-term trend) - blue,
Senkou Span A (SSA) - pink.
The color of additional lines:
Support and resistance MN - blue, W1 - green, D1 - red, H4 - pink, H1 - gray,
Horizontal levels (not Ichimoku) - brown,
Trend lines - purple.
 English
 Русский
 Bahasa Indonesia
 Bahasa Malay
 ไทย
ไทย Español
 Deutsch
 Български
 Français
 Tiếng Việt
 中文
中文 বাংলা
বাংলা हिन्दी
 Čeština
 Українська
 Română

