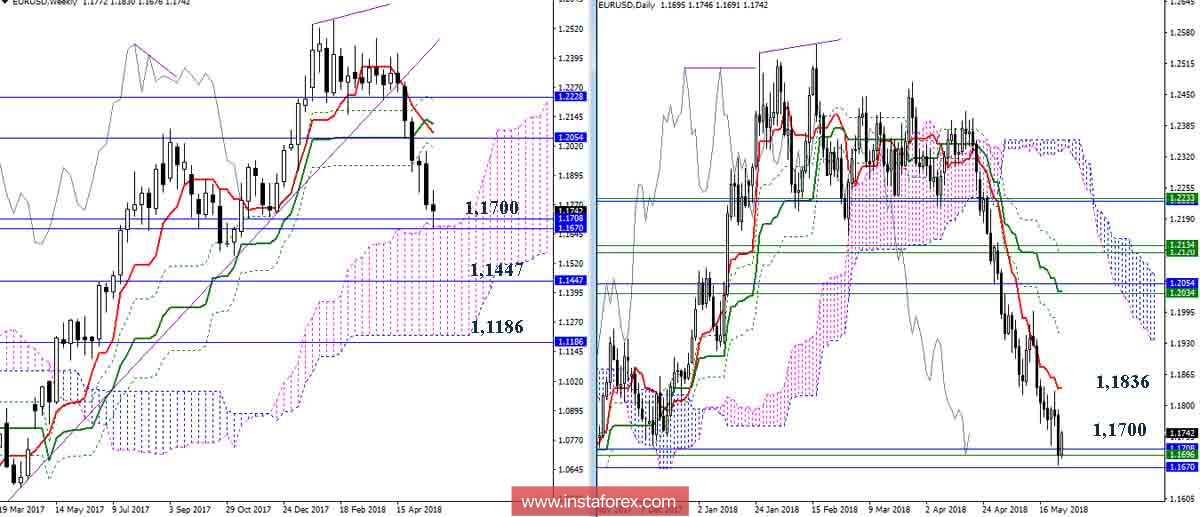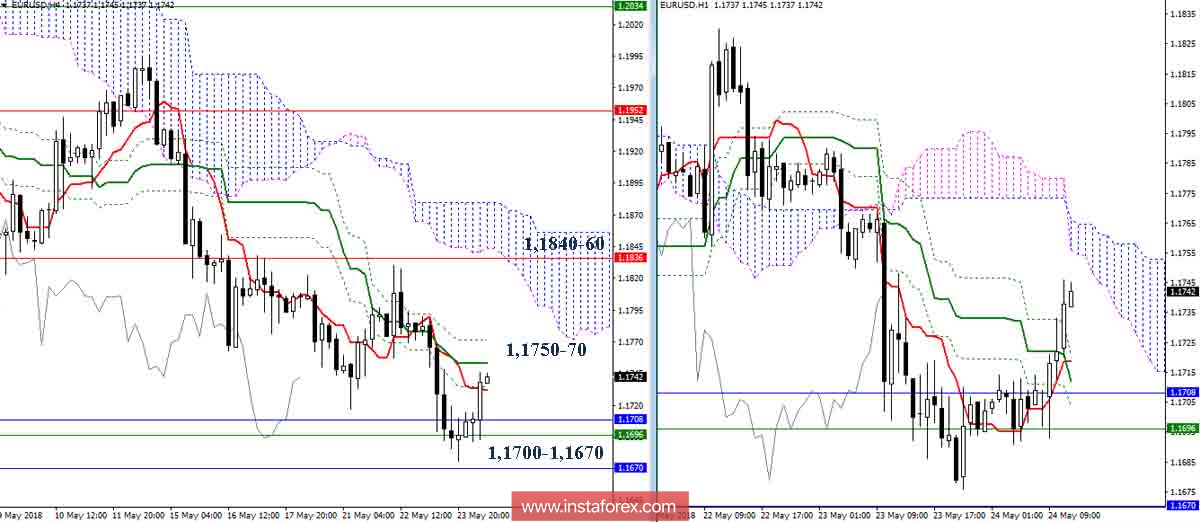
EUR / USD pair
The pair reached the zone of support for the main targets of this site (monthly Fibo Kijun 62 1,1708 + month Senkou Span A 1.1670 + week Senkou Span A 1.1696). As a result, one can now expect a breakout and development of the next upward correction. The closest benchmark and resistance in this situation is the daily short-term trend (1.1836). A reliable consolidation above can contribute to the formation of a rebound from the support levels and the emergence of new targets. If the players on the fall currently limit themselves to minor breaking and overcome support in the area of 1.1700, entrenched in a one-week cloud (Senkou Span A 1.1696), then the following bearish benchmarks will be the levels of the monthly cross (1.1447-1.1186) and the lower boundary of the weekly cloud (1.1215).

Indicator parameters:
all time intervals 9 - 26 - 52
Color of indicator lines:
Tenkan (short-term trend) - red,
Kijun (medium-term trend) - green,
Fibo Kijun is a green dotted line,
Chikou is gray,
clouds: Senkou Span B (SSB, long-term trend) - blue,
Senkou Span A (SSA) - pink.
Color of additional lines:
support and resistance MN - blue, W1 - green, D1 - red, H4 - pink, H1 - gray,
horizontal levels (not Ichimoku) - brown,
trend lines - purple.
 English
 Русский
 Bahasa Indonesia
 Bahasa Malay
 ไทย
ไทย Español
 Deutsch
 Български
 Français
 Tiếng Việt
 中文
中文 বাংলা
বাংলা हिन्दी
 Čeština
 Українська
 Română

