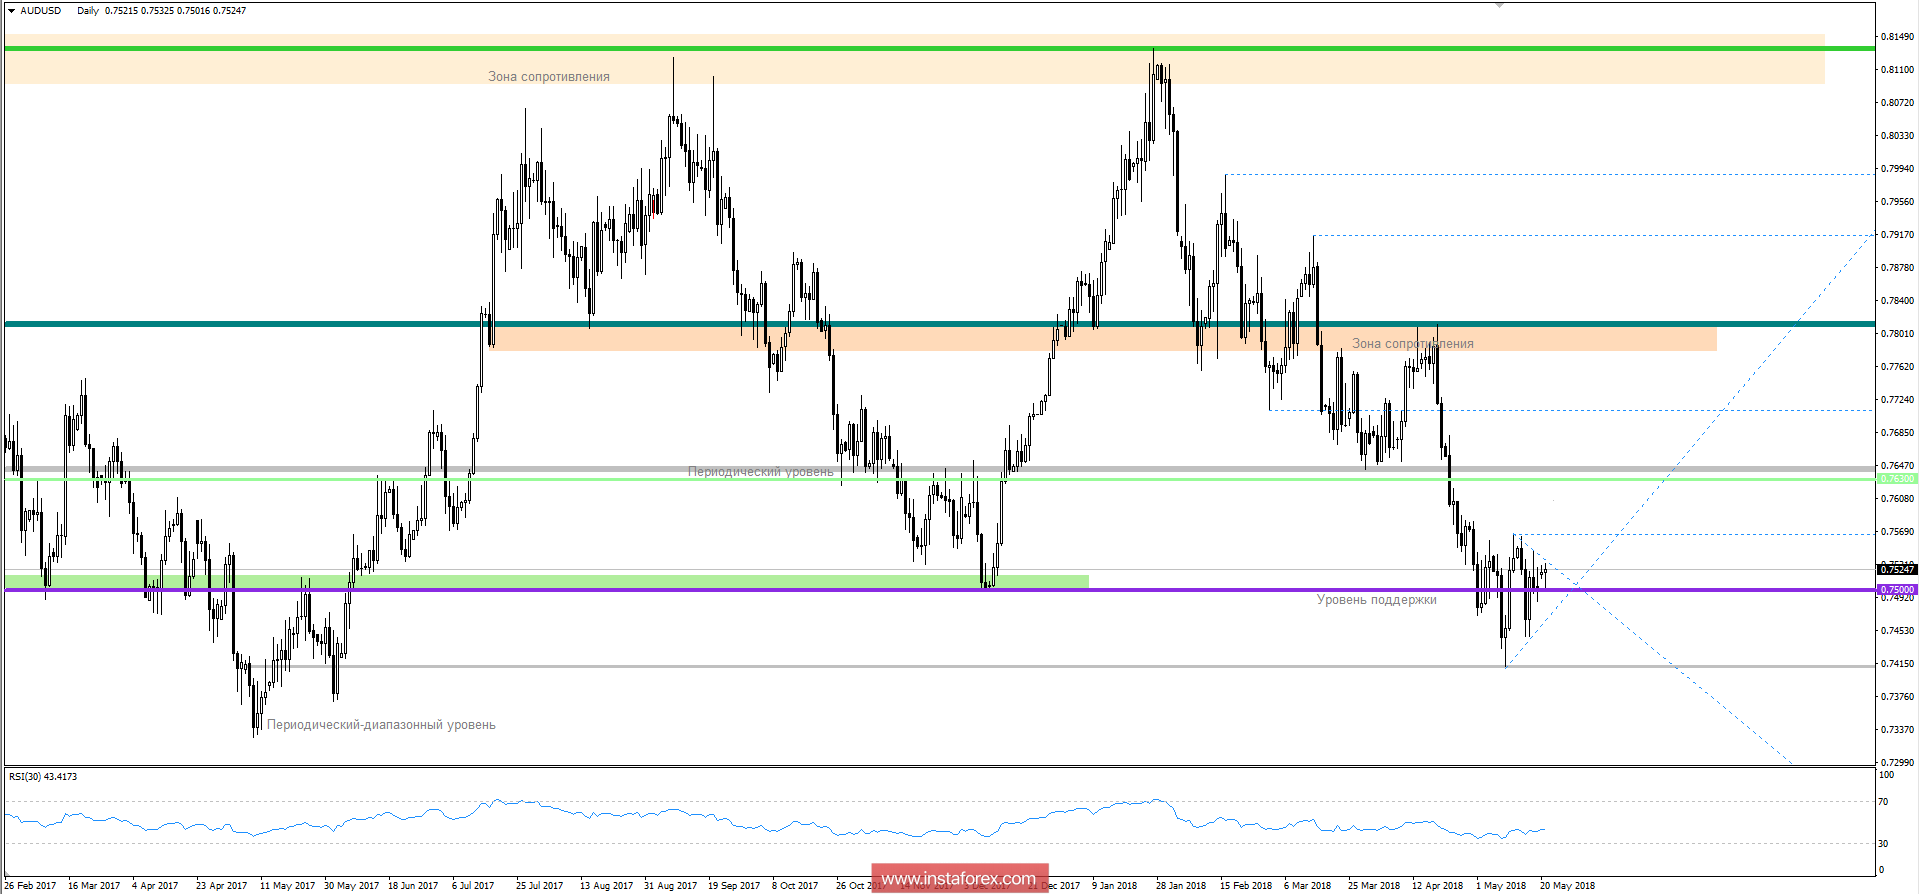
The AUDUSD currency pair continues to wobble near the 0.7500 level, drawing us the graphical model "Symmetrical triangle". Considering the graph earlier, we already discussed that the pair recently showed a fairly intense downward movement, where the level of 0.7500 stood before the quotation, reflecting support for the formation of correction. But, as we see, by the result of the "tanks" and did not manage to deploy the quotation, we just returned back to the level of 0.75. Now the waver amplitude decreases, where we see the formation of two-valued candles of the "doji" type and the general drawing of the "Triangle symmetrical" graphic model. It is possible to assume further concentration near this level, but in case of consolidation below 0.7460, new values of 0.7320/0.7150 may be opened.
At the same time, traders should not forget long positions, the dollar is overbought on all fronts, a correction has been discussed for a long time on it, but when this moment will come, it's impossible to say, but you need to be ready for it. For me personally, the point of a possible fracture of interest is 0.7570 (the fixation is above it).

 English
 Русский
 Bahasa Indonesia
 Bahasa Malay
 ไทย
ไทย Español
 Deutsch
 Български
 Français
 Tiếng Việt
 中文
中文 বাংলা
বাংলা हिन्दी
 Čeština
 Українська
 Română

