EUR / USD

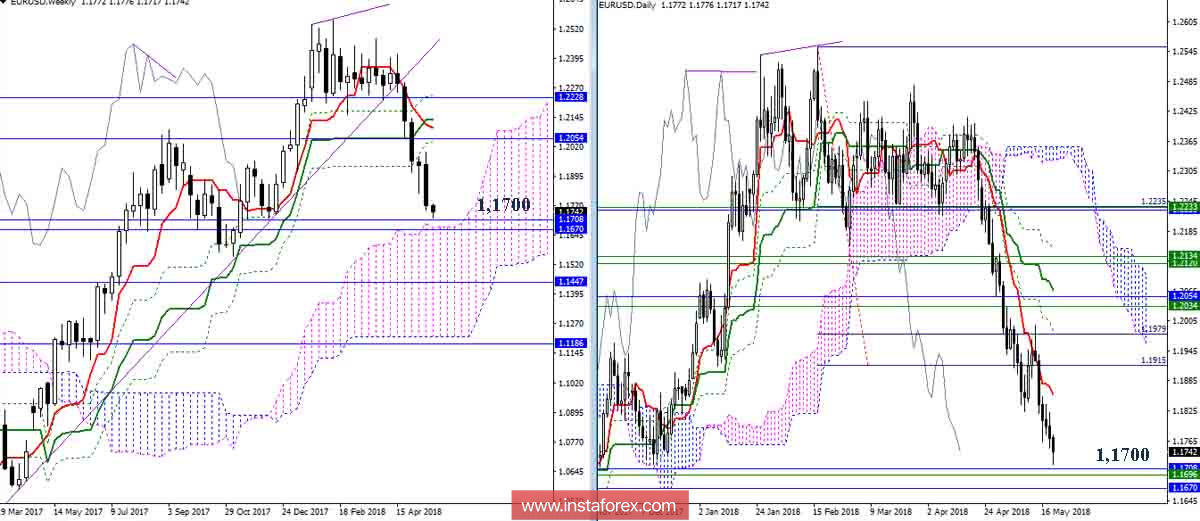
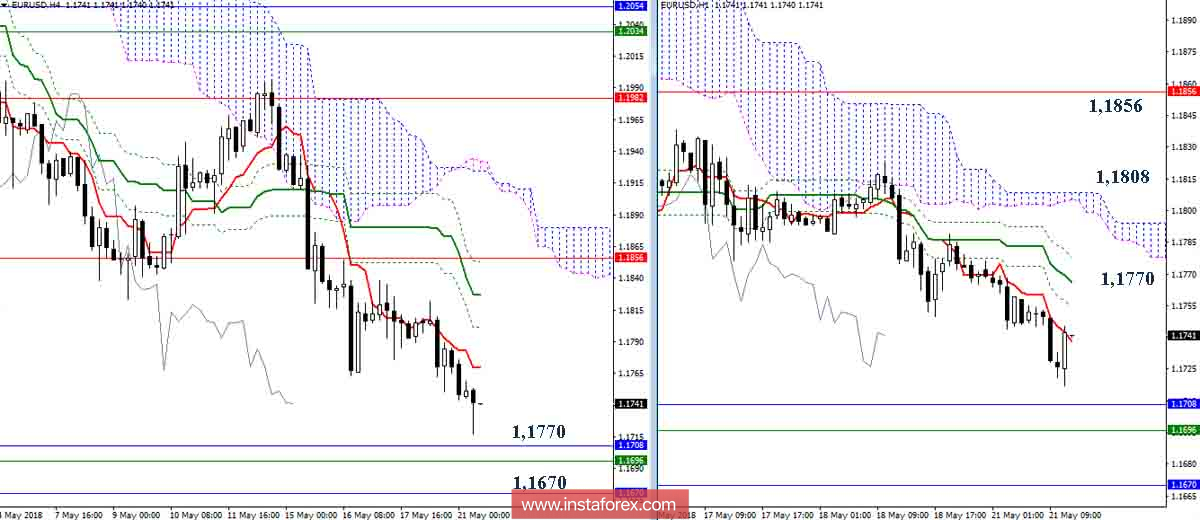
Now, the strength and benefits are still on the players' side to downgrade. The pair continues to decline, limiting itself to its path with only minimal adjustments. At the moment, we are seeing an approach to support, joining forces at the boundaries of 1.1700 (monthly Fibo Kijun 62 1.1708 + month Senkou Span A 1.1670 + week Senkou Span A 1.1696). As noted earlier, this area is the main target of the current decline, so it is possible to break, as well as the development of a full-scale upward correction. The initial stage of the correction may be a rise to the resistance of the Tenkan N4 + Kijuna N1, now it is the area of 1.1770, further interest will be the breakdown of the H1 cloud and the dead cross N4, the target benchmark of the full correction is the daytime Tenkan (current value 1,1856) and the performance of the upward targets for the breakdown of the cloud H1.
Resistance: 1.1770 - 101808 - 101856.
Supports: 1.1700 - 1.1670.

Indicator parameters:
All time intervals 9 - 26 - 52
The color of indicator lines:
Tenkan (short-term trend) - red,
Kijun (medium-term trend) - green,
Fibo Kijun is a green dotted line,
Chinkou is gray,
Clouds: Senkou Span B (SSB, long-term trend) - blue,
Senkou Span A (SSA) - pink.
The color of additional lines:
Support and resistance MN - blue, W1 - green, D1 - red, H4 - pink, H1 - gray,
Horizontal levels (not Ichimoku) - brown,
Trend lines - purple.
 English
 Русский
 Bahasa Indonesia
 Bahasa Malay
 ไทย
ไทย Español
 Deutsch
 Български
 Français
 Tiếng Việt
 中文
中文 বাংলা
বাংলা हिन्दी
 Čeština
 Українська
 Română

