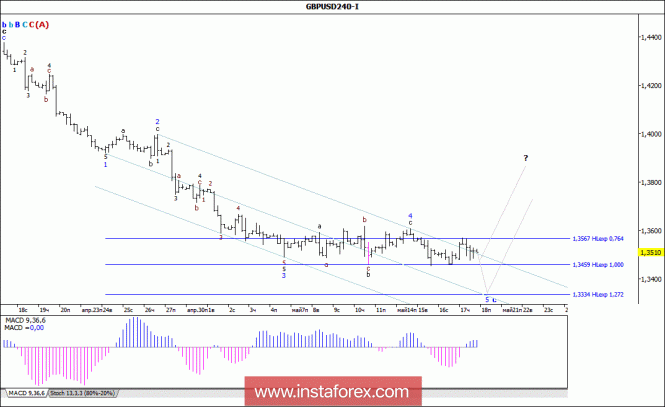
Analysis of wave counting:
During the yesterday's trading, the GBP / USD currency pair could not determine the direction of the movement, remaining until the end of the day within a fairly narrow price range near the level of the 35th figure. The resulting wave situation still allows us to assume that the currency pair continued to make attempts to complete the formation of the wave 5, c, b, B, C, C, (A). At the same time, a somewhat prolonged pause may trigger the resumption of the decline in quotations to 1.3335 and further complicate the internal wave structure of wave c, b, B, C, C, (A).
The objectives for the option with purchases:
1.3647 - 76.4% of Fibonacci
1.3700
The objectives for the option with sales:
1.3459 - 100.0% of Fibonacci
1.3334 - 127.2% of Fibonacci
General conclusions and trading recommendations:
The tool continues to complicate the wave structure of the wave c, b, B, C, C, (A). Now, I recommend to remain in sales with targets that are near the estimated marks of 1.3459 and 1.3334, which corresponds to 100.0% and 127.2% of Fibonacci. An unsuccessful attempt to break through the 1.3334 mark will warn of the readiness of the instrument to build a wave c, B, C, C, (A) with the first targets located around 37 and 38 figures, but there are no signs of starting its construction now.
 English
 Русский
 Bahasa Indonesia
 Bahasa Malay
 ไทย
ไทย Español
 Deutsch
 Български
 Français
 Tiếng Việt
 中文
中文 বাংলা
বাংলা हिन्दी
 Čeština
 Українська
 Română

