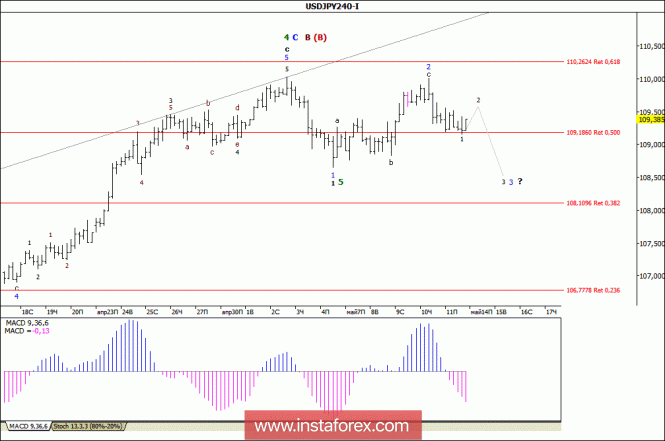
Analysis of wave counting:
During the last day of the previous week, the USD/JPY pair held within a fairly narrow price range, limited by the levels of 109.15-109.55. It can be assumed that, despite such low market activity, the currency pair remained in the stage of formation of the internal wave structure of the third wave, in the 1st, in the 5th, in the C, in the C, in (B). If this is the case, the currency pair will continue to decline quotations in the direction of the targets for this 3rd wave, in the 1st, in the 5th, in C, in C, in (B), located below the level of the 108th figure.
Targets for buying:
111.50 - 76.4% by Fibonacci
Targets for selling:
108.10 - 38.2% by Fibonacci
106.77 - 23.6% by Fibonacci
General conclusions and trading recommendations:
The upward wave 4, in C, in C, in (B) is supposedly completed, like the supposed wave 2, at 1, at 5, at C, at C, at (B). Thus, it is recommended selling the pair with targets near the estimated level of 108.10, which is equivalent to 38.2% of Fibonacci. It is recommended buying the trading instrument after a successful attempt to break through the level of 110.26, as this will mean the complication of wave 4, in C, in C, in (B).
 English
 Русский
 Bahasa Indonesia
 Bahasa Malay
 ไทย
ไทย Español
 Deutsch
 Български
 Français
 Tiếng Việt
 中文
中文 বাংলা
বাংলা हिन्दी
 Čeština
 Українська
 Română

