GBP/JPY

Higher timeframes
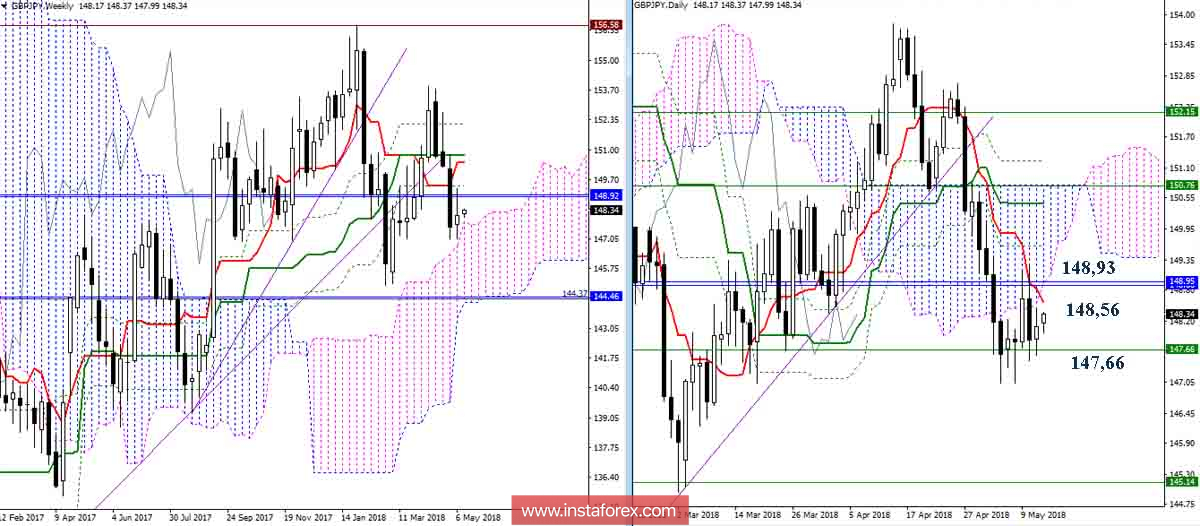
Players on the decline could not realize the potential of the previous day. As a result, the premise was raised that the upper limit of the weekly cloud (Senkou Span A 147.66) would prove to be reliable support and would be able to slow down, and perhaps even stop the decline altogether. At the moment, the main objectives of players on raising are to transfer to their side the daily short-term trend (Tenkan 148.56) and in the further rise to the day cloud (Senkou Span A 148.93), with the goal of consolidating in it. For the players on the decline the main agenda has not changed, they have to overcome the upper limit of the weekly cloud (Senkou Span A 147.66)

H4-H1
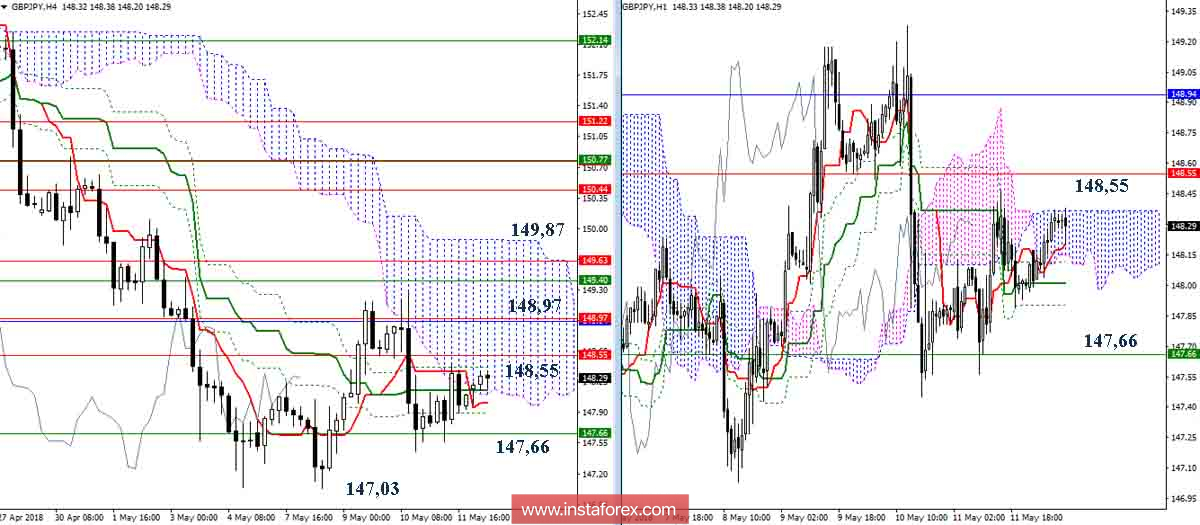
Today, the pair again tests the resistance of the bearish cloud H4 for strength, it is now quite wide and is filled with levels of resistance of the upper halves (148.55 - 148.97 - 149.40 - 149.63). Overcoming this area will form an upward target for the breakdown of the H4 cloud and will open new prospects for players to increase. If now the players on the upward can not overcome the boundaries of the clouds H4 (148.10), H1 (148.37) and cross H4 (148.42), strengthened by the daily Tenkan (148.56), then we can expect the formation of a release and new testing support 147.66 (weekly Senkou Span A). Overcoming the support and recovery of the downtrend (the minimum extremum of 147.03) will allow considering the continuation of the decline to new downward prospects.
Indicator parameters:
All time intervals 9 - 26 - 52
Color of indicator lines:
Tenkan (short-term trend) - red,
Kijun (medium-term trend) - green,
Fibo Kijun is a green dotted line,
Chinkou is gray,
Clouds: Senkou Span B (SSB, long-term trend) - blue,
Senkou Span A (SSA) - pink.
Color of additional lines:
Support and resistance MN - blue, W1 - green, D1 - red, H4 - pink, H1 - gray,
Horizontal levels (not Ichimoku) - brown,
Trend lines - purple.
 English
 Русский
 Bahasa Indonesia
 Bahasa Malay
 ไทย
ไทย Español
 Deutsch
 Български
 Français
 Tiếng Việt
 中文
中文 বাংলা
বাংলা हिन्दी
 Čeština
 Українська
 Română

