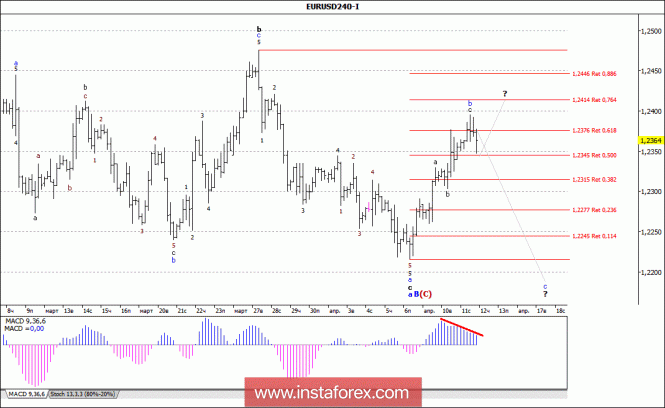
Analysis of wave counting:
Only after an unsuccessful attempt to test the level of the 24th figure, the currency pair EUR / USD began the expected decline and fell back to the mark of 1.2350 at the end of the last day. The current wave situation allows us to assume that the currency pair has completed the formation of wave b and has already designated the beginning of the wave c, c, a, B, (C). If this is the case, then the fairly convincing MACD divergence points to the prospects for the currency pair emerging for the development of the downward movement towards the level of 1.2200.
The objectives for building a downward wave:
1.2204 - 161.8% of Fibonacci
The objectives for building an upward wave:
1.2376 - 61.8% of Fibonacci
1.2434 - 76.4% of Fibonacci
General conclusions and trading recommendations:
The wave counting on the instrument involves the construction of a downward trend section. The assumed wave b, c, a, B, (C), most likely, completed its construction between the levels of 1.2376 and 1.2434, which corresponds to 61.8% and 76.4% of Fibonacci. Thus, now we expect a decline in quotes within the wave c with a target of about 22 figures.
 English
 Русский
 Bahasa Indonesia
 Bahasa Malay
 ไทย
ไทย Español
 Deutsch
 Български
 Français
 Tiếng Việt
 中文
中文 বাংলা
বাংলা हिन्दी
 Čeština
 Українська
 Română

