Analysis of wave counting:
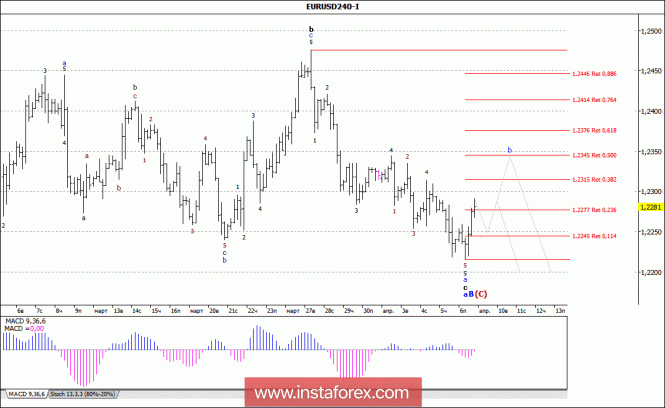
The attempt of the EUR/USD pair to continue the downward movement on Friday ended with the rebound of the price from the low of the beginning of the European session (1.2215) to the level of 1.2290. At the same time, it can be assumed that the currency pair has already completed the formation of a wave of a, in c, in a, in B, in (C), which has taken the form of a five-wave structure. If this is so, and wave a, in c, in a, in B, in (C), will not take an even more complicated form, then the growth of quotations indicated on the last day of the last week may be the beginning of the future wave b, in c, in a, in B, in (C).
Targets for a downward wave option:
1.2204 - 161.8% by Fibonacci
Targets for an upward wave option:
1.2315 - 38.2% by Fibonacci
1.2345 - 50.0% by Fibonacci
General conclusions and trading recommendations:
Wave marking on the trading instrument involves the construction of a downward trend section. Now the quotations are expected to increase within wave b, in c, in a, in B, in (C) with targets near the estimated marks of 1.2315 and 1.2345, which corresponds to 38.2% and 50.0% of Fibonacci . After the completion of this wave, the decline in quotations may resume with targets below 22 figures.
 English
 Русский
 Bahasa Indonesia
 Bahasa Malay
 ไทย
ไทย Español
 Deutsch
 Български
 Français
 Tiếng Việt
 中文
中文 বাংলা
বাংলা हिन्दी
 Čeština
 Українська
 Română

