Analysis of wave counting:
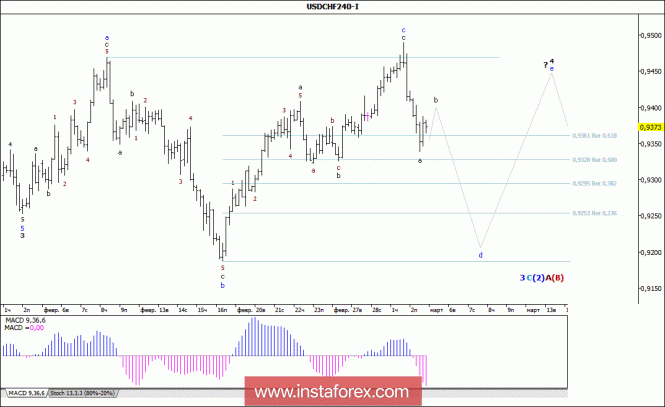
In general, it is expected, that during the Friday's trading, the currency pair USD / CHF began with the continuation of the downward movement, which was indicated on the eve, having lost about 80 percentage points and already reached the level of 0.9340 in the middle of the day. The resulting wave situation allows us to assume that by such a decrease in the price, the currency pair confirms the transition to the stage of formation of the future wave d in the form of the horizontal wave 4, 3, C, (2), A, (B). If this is the case, the currency pair may continue to decline the quotations to the level of the 92nd figure, or to the level of 0.9150, although on a more complex inclined trajectory.
The objectives for the option with an upward wave:
0.9450
The objectives for the option with a downward wave:
0,9194 - 127.2% of Fibonacci
0.9152 - 161.8% of Fibonacci
General conclusions and trading recommendations:
The currency pair continues to build a downward set of waves. The assumed wave 3, C, (2), A, (B) continues its construction and becomes more complicated, within its internal wave d, 4, the decrease in quotations can continue with targets located near the calculated marks of 0.9194 and 0.9152, which corresponds to 127.2% and 161.8% of Fibonacci.
 English
 Русский
 Bahasa Indonesia
 Bahasa Malay
 ไทย
ไทย Español
 Deutsch
 Български
 Français
 Tiếng Việt
 中文
中文 বাংলা
বাংলা हिन्दी
 Čeština
 Українська
 Română

