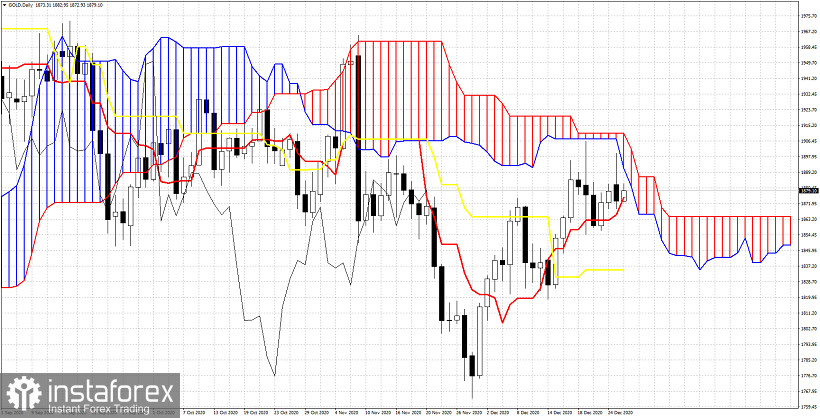
Gold price remains below key cloud resistance. As we explained in previous analysis, the $1,900 level remains important resistance and in order for bulls to hope for another run towards $1,980-$2,000 level, they need to recapture $1,900. On the other hand failure to do so combined with a break below $1,850 will lead to a move lower towards $1,800-$1,790.

Gold price might be trading above the tenkan-sen (Red line indicator) and the kijun-sen (yellow line indicator) but remains below the Kumo (cloud). Resistance as shown in the Daily chart above is at $1,890-$1,905. Support is at $1,875 by the tenkan-sen and at $1,835 by the kijun-sen. The Chikou span (black line indicator) is trying to move above the candlestick pattern. Gold is at a crucial junction. What Gold price does over the next couple of sessions will decide next months direction.
*The market analysis posted here is meant to increase your awareness, but not to give instructions to make a trade

 English
 Русский
 Bahasa Indonesia
 Bahasa Malay
 ไทย
ไทย Español
 Deutsch
 Български
 Français
 Tiếng Việt
 中文
中文 বাংলা
বাংলা हिन्दी
 Čeština
 Українська
 Română

