Crypto Industry News:
Riot Blockchain, a Nasdaq-listed cryptocurrency mining company, has signed another purchase agreement with the Chinese mining giant Bitmain. Riot has bought 15,000 Antminers. The company expects the purchase to increase their total hash rate by 65%.
The purchase cost $ 35 million. 3000 Antminer S19 Pro and 12000 Antminer S19j Pro were purchased. Riot blockchain expects to receive and deploy new excavators between May 2021 and October 2021.
With this latest purchase, Riot is further expanding its bitmain range of machines. With over 37,000 miners fully deployed, Riot estimates that the hash rate will increase from 2.3 EH / s to 3.8 EH / s. The energy consumption is estimated at around 120 megawatts of energy.
Bitmain consistently delivers its latest Antminers to Riot Blockchain as part of an affiliate agreement. In October 2020, the companies signed a contract to deliver 2,500 Antminer S19 Pro. These were the next contracts, apart from orders from the previous batch of 5,100 units and another for 8,000 devices from September.
Technical Market Outlook:
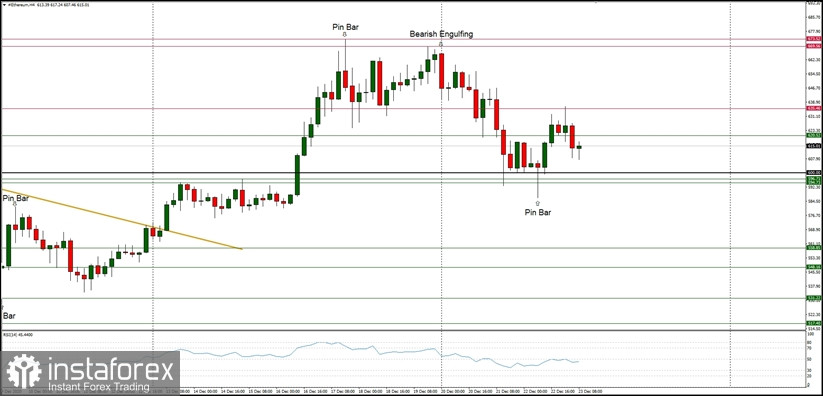
The ETH/USD pair had made a Pin Bar candle at the top of the rally at $673.52 at the H4 time frame chart, so now the local pull-back is in progress. The bears have managed to push the price to the level of $592.93 before the bounce towards $632. The momentum has declined and is currently below the level of fifty, so the sentiment had changed to negative. This means the bulls might not attack the level of $700 again soon, because the corrective cycle has not been completed yet. The next technical resistance is seen at the level of $673.52 and the technical support is located at $600 and $620.52.
Weekly Pivot Points:
WR3 - $777.02
WR2 - $722.62
WR1 - $678.76
Weekly Pivot - $626.41
WS1 - $580.02
WS2 - $527.98
WS3 - $482.35
Trading Recommendations:
The up trend on the Ethereum continues and the next long term target for ETH/USD is seen at the level of $700, so any correction or local pull-back should be used to open the buy orders. Nevertheless, the momentum has decreased recently on the lower time frames and volatility is not that great either. The bulls has hit the 38% Fibonacci retracement located at the level of $587.87 on the weekly time frame chart, but the current up trend is still active. This scenario is valid as long as the level of $360 is broken.

 English
 Русский
 Bahasa Indonesia
 Bahasa Malay
 ไทย
ไทย Español
 Deutsch
 Български
 Français
 Tiếng Việt
 中文
中文 বাংলা
বাংলা हिन्दी
 Čeština
 Українська
 Română

