Crypto Industry News:
While users affected by Ledger data dump threaten legal action, some wallet owners may be at risk of being visited by criminals. Moreover, some users started receiving threatening emails asking for $ 500. However, if they do not follow these guidelines, they may be attacked in their homes.
This situation opens up another risk factor for Ledger users whose private information has been exposed by the hacker. In addition to the home invasion, the affected Ledger owners also have to deal with phishing and SIM replacement exploits, among others.
Actual Bitcoin-related attacks are not uncommon, especially when the victim is known to be the holder of a popular cryptocurrency. In September 2019, a Norwegian millionaire was reportedly forced to jump off a second-floor balcony in order to escape with armed robbers.
Ledger ledger dump also provides a clear relief from the dangers of centralized customer data storage. In the meantime, the US government is striving for tighter compliance with Know Your Customer principles for unsecured wallet owners.
Technical Market Outlook:
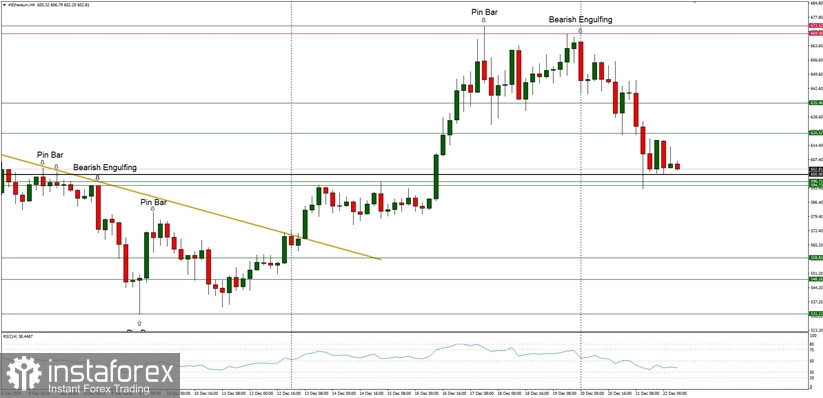
The ETH/USD pair had made a Pin Bar candle at the top of the rally at $673.52 at the H4 time frame chart, so now the local pull-back is in progress. The bearish have managed to push the price to the level of $592.93 before the bounce. The momentum has declined, but is still strong and positive at the higher time frame, so the bulls might attack the level of $700 again soon. The next technical resistance is seen at the level of $673.52 and the technical support is located at $635.46 and $620.52.
Weekly Pivot Points:
WR3 - $777.02
WR2 - $722.62
WR1 - $678.76
Weekly Pivot - $626.41
WS1 - $580.02
WS2 - $527.98
WS3 - $482.35
Trading Recommendations:
The up trend on the Ethereum continues and the next long term target for ETH/USD is seen at the level of $700, so any correction or local pull-back should be used to open the buy orders. Nevertheless, the momentum has decreased recently on the lower time frames and volatility is not that great either. The bulls has hit the 38% Fibonacci retracement located at the level of $587.87 on the weekly time frame chart, but the current up trend is still active. This scenario is valid as long as the level of $360 is broken.

 English
 Русский
 Bahasa Indonesia
 Bahasa Malay
 ไทย
ไทย Español
 Deutsch
 Български
 Français
 Tiếng Việt
 中文
中文 বাংলা
বাংলা हिन्दी
 Čeština
 Українська
 Română

