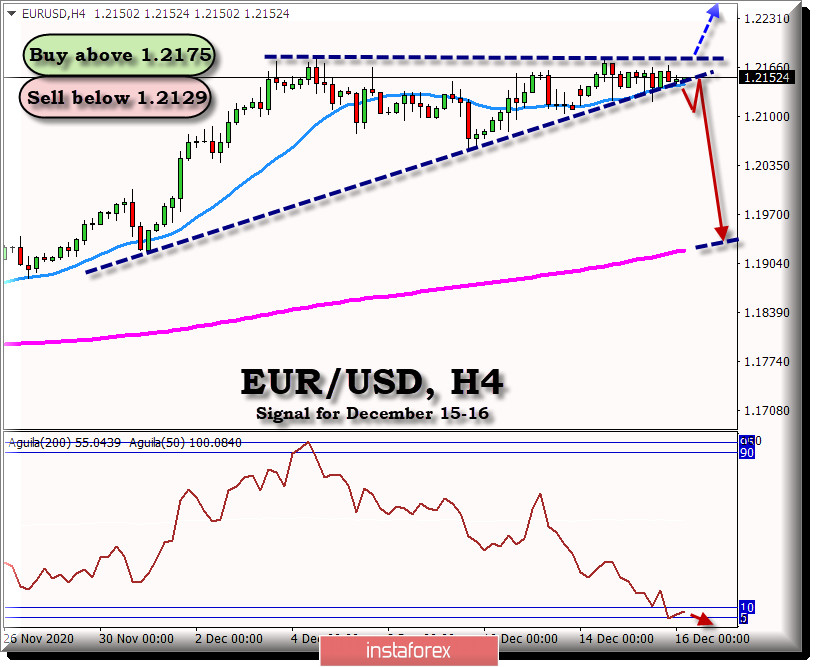
On December 3, EUR/USD hit resistance of 1.2175. Since that date until now, the pair has been consolidating below this zone, trading within a range of 95 pips as you can see in the chart.
This price range that the euro is leaving is a sign of an accumulation phase, awaiting the decision of the FOMC. Once the market has digested the news, we could see a break at any direction. The market appears to be preparing for a breakout to the upside.
On the other hand, market sentiment is waning in the face of impatience. More and more euro buyers are entering the market every day, and fears of a possible bullish breakout assure sellers to close their positions.
From a short-term technical perspective, the currency pair will confirm a breakout of the ascending triangle, if it manages to close above the 1.2175 resistance. Above this level a test of the level of 1.2207 (8/8) and 1.2268 is inevitable.
At the writing of this article the pair is trading above the 21 SMA, above 1.2145. If it remains above this level, we could expect a potential upside. On the other hand, if it breaks down and pulls below 1.2129, we could expect a drop to the base of the 1.2075 range.
An hourly close below the uptrend line support at 1.2129 and a break below the 1.2075 range could encourage bearish positions, and targeting up to the 200 EMA at 1.1925.

 English
 Русский
 Bahasa Indonesia
 Bahasa Malay
 ไทย
ไทย Español
 Deutsch
 Български
 Français
 Tiếng Việt
 中文
中文 বাংলা
বাংলা हिन्दी
 Čeština
 Українська
 Română

