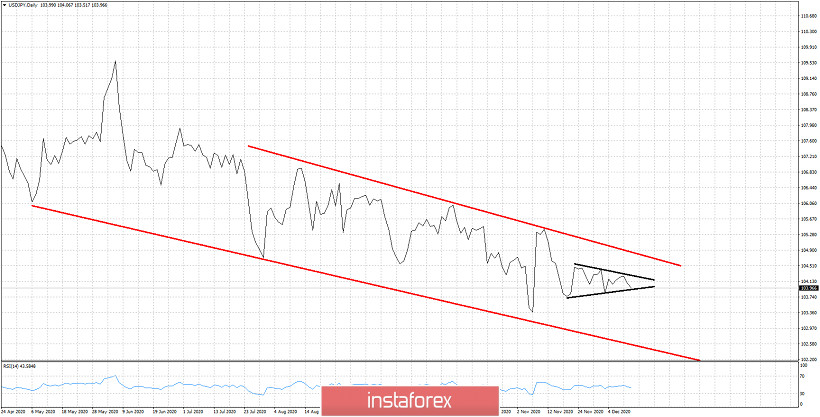
USDJPY remains inside the bearish channel we have mentioned before. However recent sideways price action has formed another technical pattern. Price has formed a triangle pattern and traders better keep a close eye on the boundaries of the triangle as it will affect the short-term trend.

Black lines - triangle pattern
USDJPY remains in a bearish trend and we continue to expect a move towards 103 as long as price is below 105.50. In the short-term price as shown in the 4 hour chart above has formed a triangle pattern with upper boundary at 104.40 and lower boundary at 103.85. Any break out of the triangle will open the way for a move closer towards the channel boundaries. Traders now need to be patient and let the market show us the direction.
 English
 Русский
 Bahasa Indonesia
 Bahasa Malay
 ไทย
ไทย Español
 Deutsch
 Български
 Français
 Tiếng Việt
 中文
中文 বাংলা
বাংলা हिन्दी
 Čeština
 Українська
 Română

