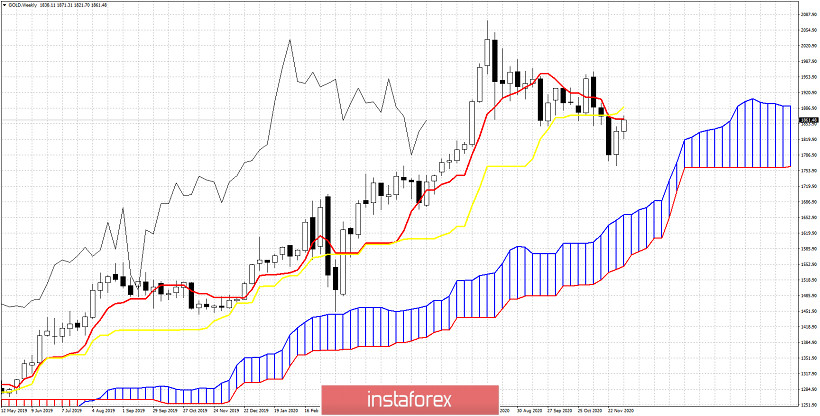
Gold price is challenging key weekly resistance. In our previous analysis we noted that Gold is trading below key resistance at $1,850-60. What was once support is now resistance. According to the Ichimoku cloud indicator this area is confirmed resistance and a weekly close above will be a bullish sign.

Gold price is above the weekly Kumo (cloud). Weekly trend is bullish. However as we explained in previous posts, Gold price was vulnerable for a pull back towards $1,800-$1,750. There is potential of price falling even lower towards cloud support around $1,725-$1,670. Price is below both the tenkan-sen (red line indicator) and the kijun-sen (yellow line indicator). As long as price is below these two indicators, price is vulnerable to another downward move. The Ichimoku cloud indicator confirms what our recent analysis says. Bulls need to recapture $1,850-60 and stay above it.
*The market analysis posted here is meant to increase your awareness, but not to give instructions to make a trade

 English
 Русский
 Bahasa Indonesia
 Bahasa Malay
 ไทย
ไทย Español
 Deutsch
 Български
 Français
 Tiếng Việt
 中文
中文 বাংলা
বাংলা हिन्दी
 Čeština
 Українська
 Română

