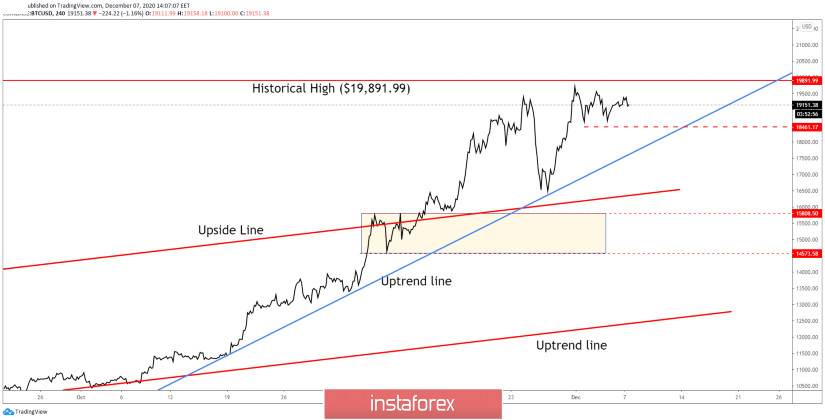
BTC/USD moves sideways in the short term after failing to close above the $19,891 all-time high or to reach the $20,000 psychological level. The price has decreased a little as some traders have closed their long positions somewhere around the historical high.
As you can see on the H4 chart, the uptrend is intact and the price is located far above the first uptrend line signaling further growth. So, only a drop under the $18,461 level or below the uptrend line could invalidate more gains and could signal a strong drop in the short term.
Registering a new higher high passing above $19,891 makes BTC/USD very attractive for buyers. Also, the uptrend line retest represents a buying signal as well.
 English
 Русский
 Bahasa Indonesia
 Bahasa Malay
 ไทย
ไทย Español
 Deutsch
 Български
 Français
 Tiếng Việt
 中文
中文 বাংলা
বাংলা हिन्दी
 Čeština
 Українська
 Română

