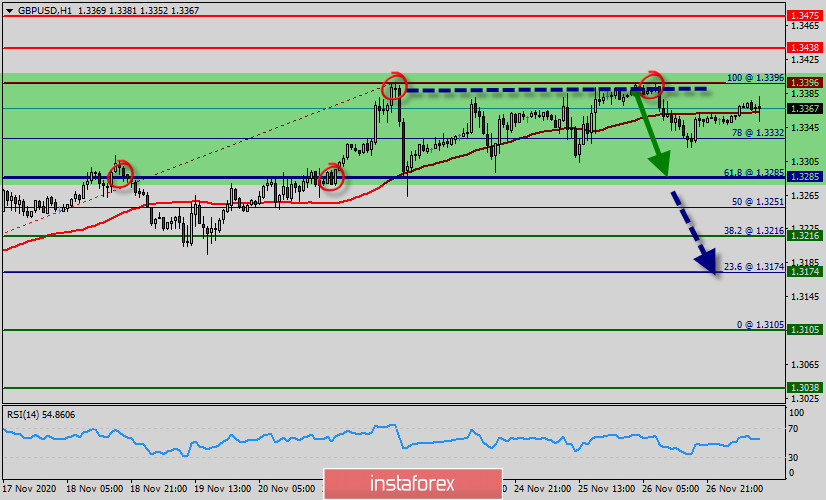
- Pair : GBP/USD.
- Pivot : 1.3285.
- Trend : Sideways.
- Forecast : Bearish market.
- Range : 1.3396 -1.3285
The GBP/USD pair is trying to settle below the top of 1.3396.The trend of GBP/USD pair movement was controversial as it took place in a narrow sideways channel, the market showed signs of instability. Amid the previous events, the price is still moving between the levels of 1.3396 and 1.3285.
If the GBP/USD pair declines below the level of 1.3396, it will gain downside momentum and head towards the next support at the yearly lows at 1.3285 which will be bearish for GBP/USD.
The nearest resistance level for the GBP/USD pair is located at the recent highs at 1.3396, although the GBP/USD pair may also face some resistance at the high of the previous trading day at 1.3396.
This week, the market moved from its bottom at 1.3285 and continued to rise towards the top of 1.3396.
Today, in the one-hour chart, the current drop will remain within a framework of correction. This would suggest a bearish market because the RSI indicator is still in a negative area and does not show any trend-reversal signs. The pair is expected to drop lower towards at least 1.3285 with a view to test the daily pivot point.
However, if the pair fails to pass through the level of 1.3396, the market will indicate a bearish opportunity below the strong resistance level of 1.3396 (the level of 1.3396 coincides with the double top too).
Sell deals are recommended below the level of 1.3396 with the first target at 1.3285. If the trend breaks the support level of 1.3285, the pair is likely to move downwards continuing the development of a bearish trend to the level 1.3216 in order to test the daily support 2 (horizontal green line).
On the support side, the nearest support level for the GBP/USD pair is located at 1.3216. If the GBP/USD pair declines below this level, it will head towards the next support at 1.3174. A move below this support level will open the way to the test of the support at the 50 EMA at 1.3174.
The price spot of 1.3396 remains a significant resistance zone. Thus, the trend is still bearish as long as the level of 1.3400 is not breached.
At the same time, if a breakout happens at the support levels of 1.3400, then this scenario may be invalidated. But in overall, we still prefer the bearish scenario.
 English
 Русский
 Bahasa Indonesia
 Bahasa Malay
 ไทย
ไทย Español
 Deutsch
 Български
 Français
 Tiếng Việt
 中文
中文 বাংলা
বাংলা हिन्दी
 Čeština
 Українська
 Română

