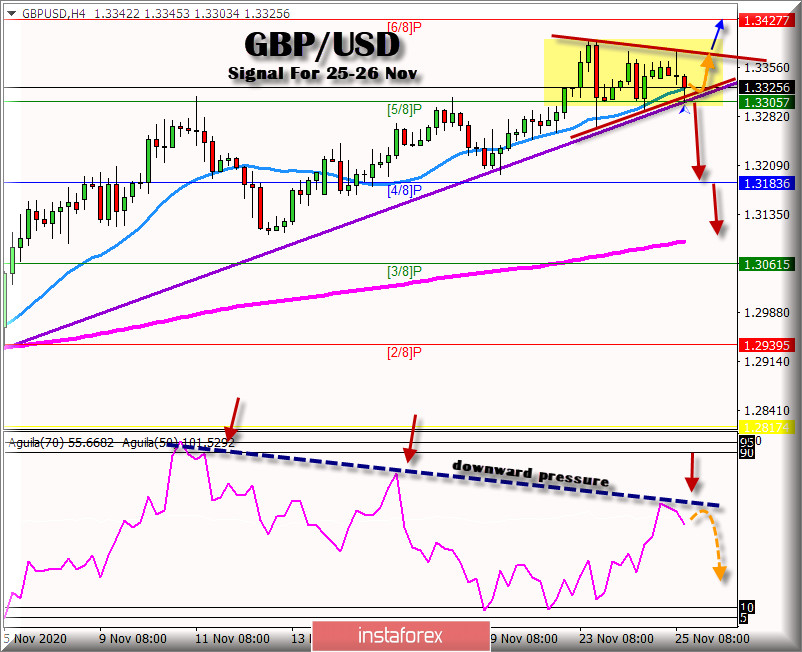
The GBP/USD pair on a 4-hour chart has formed an ascending triangle pattern, this is a bullish continuation figure. At this moment it is trading within this zone, and above the 21 EMA of 1.3328 and above the trend channel in 4 hours.
All these details indicate that the British pound is in bullish momentum, however, the eagle indicator is moving below a bearish channel. What could happen, if the 1.3305 level breaks, it would change the trend in the short term.
Therefore, we must be careful, because if the pair breaks the ascending triangle, our objective will be the area of 1.3427 (6/8 of murray) and the psychological level of 1.35.
Conversely, a break below the opposite side of the triangle, meaning below 1.3305, a bearish move could occur up to (4/8 murray and the 200-day EMA) 1.3183 and 1.3070 respectively.
The market sentiment is constant today, Wednesday, it is seen that 63% of investors are selling this pair, since it is likely that it will continue to decrease short positions and increase buyers, this is a sign that the pair could make corrections to the support levels of the 200-day EMA.
Our recommendation is to buy or sell, outside of the pattern indicated above, if you operate within the triangle, be very careful, then, because a break could occur to one of those areas. We leave our signal for GBP / USD below.
Trading tip for GBP/USD for November 25 - 26
Buy with a convincing break above the triangle 1.3370 with take profit at 1.3427 and 1.3500, stop loss below 1.3330
Sell with a convincing break below the triangle at 1.3305 (break out trend line) with take profit at 1.3260 and 1.3180 stop loss above 1.3355.
 English
 Русский
 Bahasa Indonesia
 Bahasa Malay
 ไทย
ไทย Español
 Deutsch
 Български
 Français
 Tiếng Việt
 中文
中文 বাংলা
বাংলা हिन्दी
 Čeština
 Українська
 Română

