English
  Русский
 Bahasa Indonesia
 Bahasa Malay
 ไทย
ไทย Español
 Deutsch
 Български
 Français
 Tiếng Việt
 中文
中文 বাংলা
বাংলা हिन्दी
 Čeština
 Українська
 Română

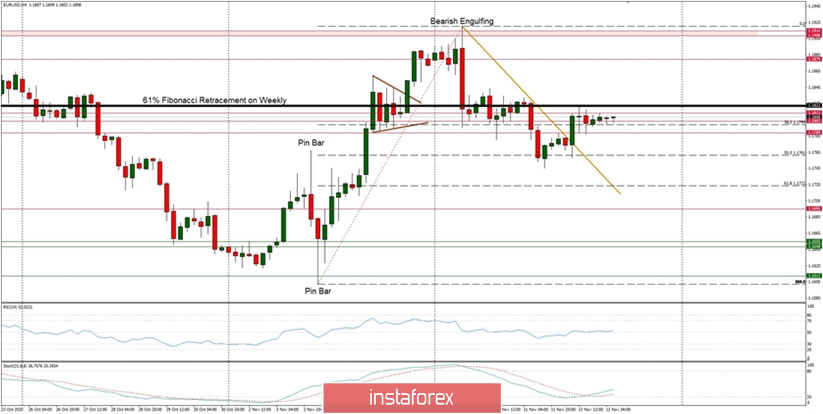
Technical Market Outlook:
After the EUR/USD pair has hit the 50% Fibonacci retracement of the last wave up located at the level of 1.1761 the market conditions become oversold at the H4 time frame and the price bounced. The short-term trend line had been violated and the market made a high at the level of 1.1822 (61% Fibonacci retracement on weekly time frame). Nevertheless, the bounce is corrective in nature and might be terminated shortly. The next target for bears is seen at the level of 61% Fibonacci retracement seen at 1.1732. The nearest technical resistance is located at 1.1835 and will act as a intraday level. The weak and negative momentum supports the short-term bearish outlook.
Weekly Pivot Points:
WR3 - 1.2308
WR2 - 1.2092
WR1 - 1.2015
Weekly Pivot - 1.1812
WS1 - 1.1717
WS2 - 1.1522
WS3 - 1.1441
Trading Recommendations:
Since the middle of March 2020 the main trend is on EUR/USD pair has been up, which can be confirmed by almost 10 weekly up candles on the weekly time frame chart and 4 monthly up candles on the monthly time frame chart. The recent correction towards the level of 1.1612 seems to be completed and now market is ready for another wave up. This means any local corrections should be used to buy the dips until the key technical support is broken. The key long-term technical support is seen at the level of 1.1445. The key long-term technical resistance is seen at the level of 1.2555.