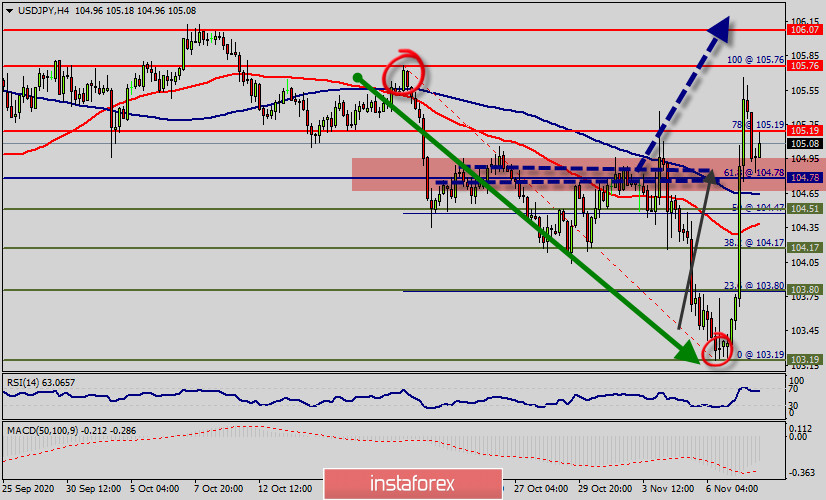
The USD/JPY pair is rising above the level of 103.80 as Yen yields drop. The trend continues benefiting from upside momentum on the four-hour chart and holds well above the 50, 100, and 200 Simple Moving Averages. The Relative Strength Index (RSI) is hovering around 70, far from overbought conditions.
The USD/JPY broke trend line after the US president election 2020.
The US Dollar remains bullish for that USD shows strong bullish momentum above the area of 104.17 - 104.78.
Therefore, we guess that USD/JPY continues to show strong volatility and gained about 2% last week. There are some events in the upcoming hours, including FOMC Member Lael Brainard Speaks, and FOMC Member Robert Kaplan Speaks. Here is an outlook at the highlights and an updated technical analysis for USD/JPY.
The USD/JPY pair broke resistance which turned to strong support at the level of 104.17 yesterday. The level of 104.17 coincides with 38.2% of Fibonacci, which is expected to act as major support today.
Since the trend is above the 38.2% Fibonacci level, it means the market is still in a uptrend. From this point, the USD/JPY pair is continuing in a bullish trend from the new support of 104.17.
This is shown to us as the current price is in a bullish channel. According to the previous events, we expect that the USD/JPY pair will move between 104.17 and 106.48.
On the H4 chart, resistances are seen at the levels of 105.78, 106.07 and 106.48. Also, it should ne noticed that, the level of 104.78 is representing the daily pivot point.
Hence, the first support will be formed at the level of 104.78 providing a clear signal for buy deals with the targets seen at 105.78. If the trend breaks the resistance at 105.78 (first resistance).
Thereupon, it is possible that the pair will move upwards continuing the development of the bullish trend to the level 106.07 in order to test the daily resistance 2 then reach next objective of 106.48. However, stop-loss is to be placed below the price of 103.19.
 English
 Русский
 Bahasa Indonesia
 Bahasa Malay
 ไทย
ไทย Español
 Deutsch
 Български
 Français
 Tiếng Việt
 中文
中文 বাংলা
বাংলা हिन्दी
 Čeština
 Українська
 Română

