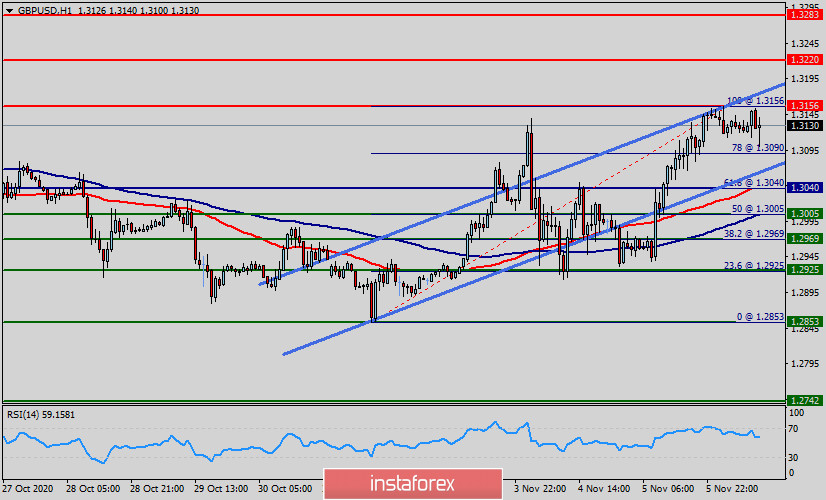
The chart of GBP/USD shows that the market has begun to drive higher again above the spot of 1.3040 - 1.3100.
The GBP/USD pair might then aim to surpass the 1.3040 mark and head towards testing the 1.3156 horizontal resistance (double top).
The RSI indicators are swinging higher once more in still strongly positive configuration.
The recent uptrend lends support around 1.3070 today, while the hourly chart shows good initial support at 1.3040 (pivot).
This is an important note that the GBP/USD pair has retreated from the highs but holding above 1.3040 as the US election count continues and the US Nonfarm Payrolls are awaited. Brexit developments are also awaited.
Also, the US COVID-19 infection rates may be showing signs of plateauing at least, but Congress is still unable to agree on a fiscal support package.
The GBP/USD pair continues to move upwards from the level of 1.3040. Yesterday, the pair rose from the level of 1.2969 to the top around 1.3156. But the pair has rebounded from the top of 1.3156 to close at 1.3130.
Today, the first support level is seen at 1.3040, the price is moving in a bullish channel now. Furthermore, the price has been set above the strong support at the level of 1.3040, which coincides with the 61.8% Fibonacci retracement level.
This resistance has been rejected several times confirming the veracity of an uptrend.
As a result, if the GBP/USD pair is able to break out the first resistance at 1.3156, the market will rise further to 0.3220 in order to test the weekly resistance 2. Consequently, the market is likely to show signs of a bullish trend.
So, we see an upside bias for 1.3100; break here aims for 1.3156 and maybe 1.3220. Intermediate-term Range Breakout Parameters : Range seen as 1.3040 to 1.3220.
Meanwhile, the outlook for GBP is positive as long as it does not move below 1.3040 (strong support level). On a shorter-term note, 1.3040 is already a strong support level. Hence, Sterling bulls seem to have taken this well.
Furthermore, if the trend is able to break out through the first resistance level at 1.3156, we should see the pair climbing towards the double top (1.3156) to test it.
Therefore, buy above the level of 1.3156 with the second target at 1.3220 and further to 1.3283. It might be noted that the level of 1.3283 is a good place to take profit because it will form a new high on the H1 chart.
On the other hand, in case a reversal takes place and the GBP/USD pair breaks through the support level of 1.3040, a further decline to 1.2925 can occur which would indicate a bearish market.
 English
 Русский
 Bahasa Indonesia
 Bahasa Malay
 ไทย
ไทย Español
 Deutsch
 Български
 Français
 Tiếng Việt
 中文
中文 বাংলা
বাংলা हिन्दी
 Čeština
 Українська
 Română

