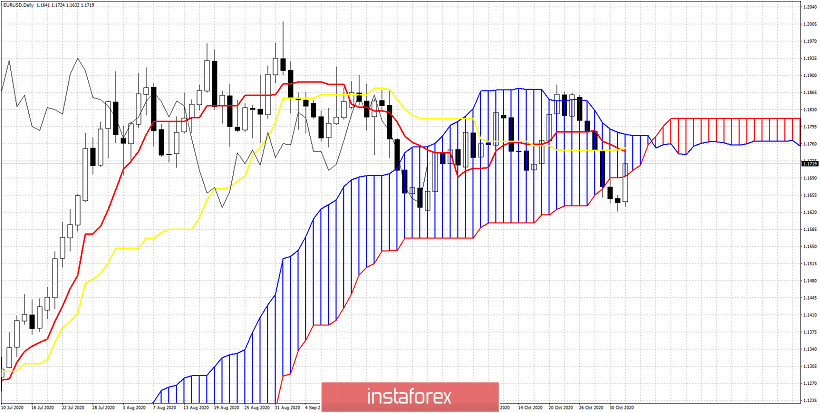
EURUSD is back testing cloud resistance after breaking below it. Price is showing signs of strength as we have moved back inside the Kumo (cloud) and we see bulls challenge the tenkan- and kijun-sen indicators).

I believe this bounce is only a pause to the correction that has started since the bearish reversal at 1.20 back in August. As long as price is below 1.1870 I see any bounce as selling opportunity. Looking closely bulls need to recapture 1.1750. Bears only want to see price get rejected at current levels and then more selling will follow. The tenkan-sen (Red line indicator) is crossing below the kijun-sen (yellow line indicator). This is a bearish sign. But with US elections on the way, we focus more on the weekly close rather than the daily or intraday price movement.
*The market analysis posted here is meant to increase your awareness, but not to give instructions to make a trade

 Relevance until