Analysis of wave counting:
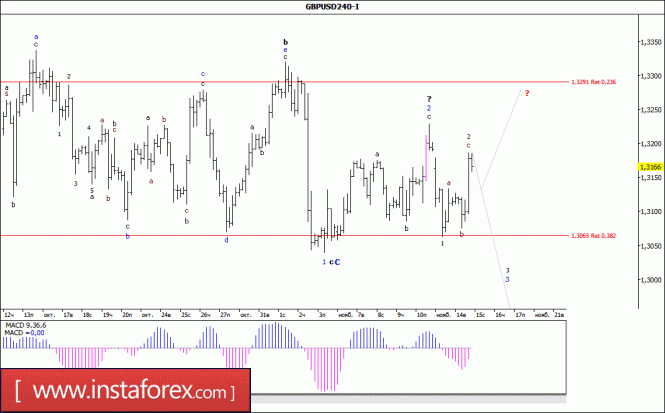
The weakening of the dollar yesterday allowed the GBP/USD pair to add more than 100 pp in price from the lows of the European session and at the end of the day to work out the mark of 1.3185. Thus, it seems that the currency pair remained in the stage of formation of the 3rd wave, in the c, in the 4th, while practically completing its internal 2nd wave. If this is the case, then from the high of the past day, the currency pair will resume the decline of quotes in the direction of the level of the 30th figure. At the same time, the currency pair still retains the potential for further complicating the internal wave structure of wave b, in the 4th and the price increase to the level of 1.3300.
Targets for a downward wave option:
1.3065 - 38.2% by Fibonacci
1.2882 - 50.0% by Fibonacci
Targets for an upward wave option:
1.3291 - 23.6% by Fibonacci
General conclusions and trading recommendations:
The construction of the downward wave 4 in the upward trend section continues. Now it is possible to lower quotes with targets near the estimated level of 1.2882, which corresponds to 50.0% of Fibonacci, within wave 3, in c, to 4. Wave b, in 4 supposedly completed its construction near the level of 1.3291, which corresponds to 23.6% of Fibonacci. Wave 2, in c, in 4 also allegedly completed its construction.
 English
 Русский
 Bahasa Indonesia
 Bahasa Malay
 ไทย
ไทย Español
 Deutsch
 Български
 Français
 Tiếng Việt
 中文
中文 বাংলা
বাংলা हिन्दी
 Čeština
 Українська
 Română

