Crypto Industry Outlook:
Bitcoin's transaction costs continue to rise, while the most popular cryptocurrency network suffers from its heaviest overload in almost three years. According to Glassnode's data source, the average transaction fee, or average transaction cost, has been 0.00086764 BTC since Wednesday, the highest since June 2018. In dollar terms, the average transaction fee was $ 11.66.
Average fees per BTC increased by 573% in the last 12 days as the price of cryptocurrency increased from $ 11,200 to $ 13,800. As you can see, even small increases can translate into a significant impact of activity in the BTC network.
Technical Market Outlook:
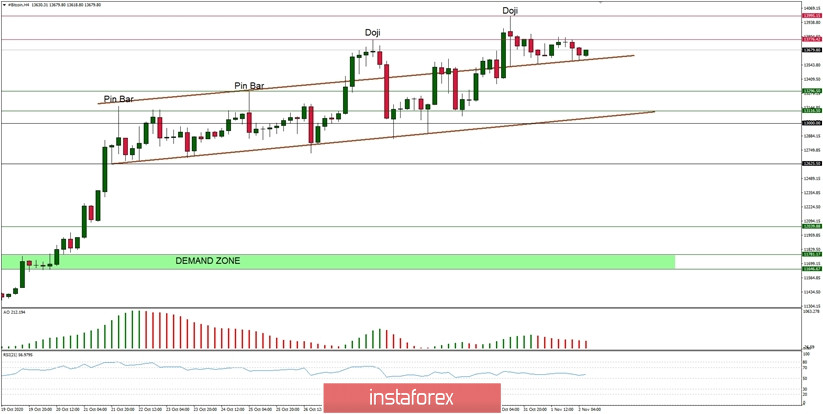
The BTC/USD pair has been trading in a narrow rage located between the levels of $13,552 - $13, 776 for all the weekend. The market is still consolidating the gains after the yearly top at the level of $13,994 was made. The market conditions are extremely overbought on H4 and daily time frame, so a pull-back or correction might occur any time now. The nearest technical support is seen at the levels of $13,296 and $13,116.
Weekly Pivot Points:
WR3 - $15,648
WR2 - $14,723
WR1 - $14,351
Weekly Pivot - $13,475
WS1 - $13,116
WS2 - $12,252
WS3 - $11,845
Trading Recommendations:
Bitcoin is trading at the yearly highs and bulls are in control of the market. The up trend continues and the next long term target for Bitcoin is seen at the level of $14,000, so any correction or local pull-back should be used to open the buy orders. This scenario is valid as long as the level of $10,000 is broken.

 English
 Русский
 Bahasa Indonesia
 Bahasa Malay
 ไทย
ไทย Español
 Deutsch
 Български
 Français
 Tiếng Việt
 中文
中文 বাংলা
বাংলা हिन्दी
 Čeština
 Українська
 Română

