 English
  Русский
 Bahasa Indonesia
 Bahasa Malay
 ไทย
ไทย Español
 Deutsch
 Български
 Français
 Tiếng Việt
 中文
中文 বাংলা
বাংলা हिन्दी
 Čeština
 Українська
 Română

GBP / JPY
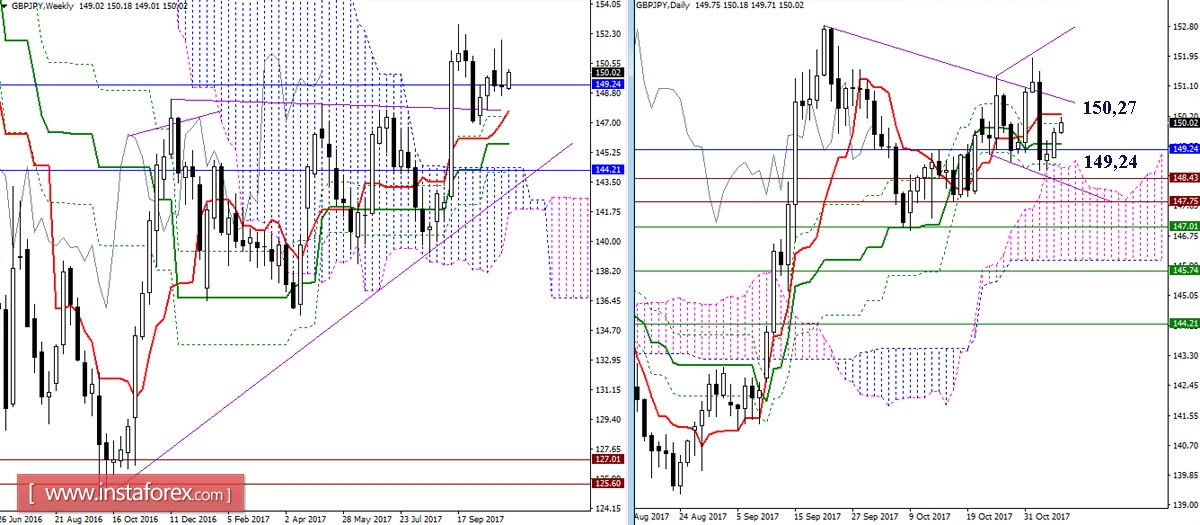
Major support led by the monthly Fibo Kijun at 149.24 and the day cloud managed again to keep the pair from falling. The resistance of the day cross is currently being tested at the Tenkan 150.27 + Fibo Kijun 150.00. Due to uncertainty, the day cross levels entered the horizontal position. As of this point, uncertainty lies within the expanding formation, as the set of highs and lows is broken. In order to change the situation, it is necessary to leave the territory of the expanding formation.
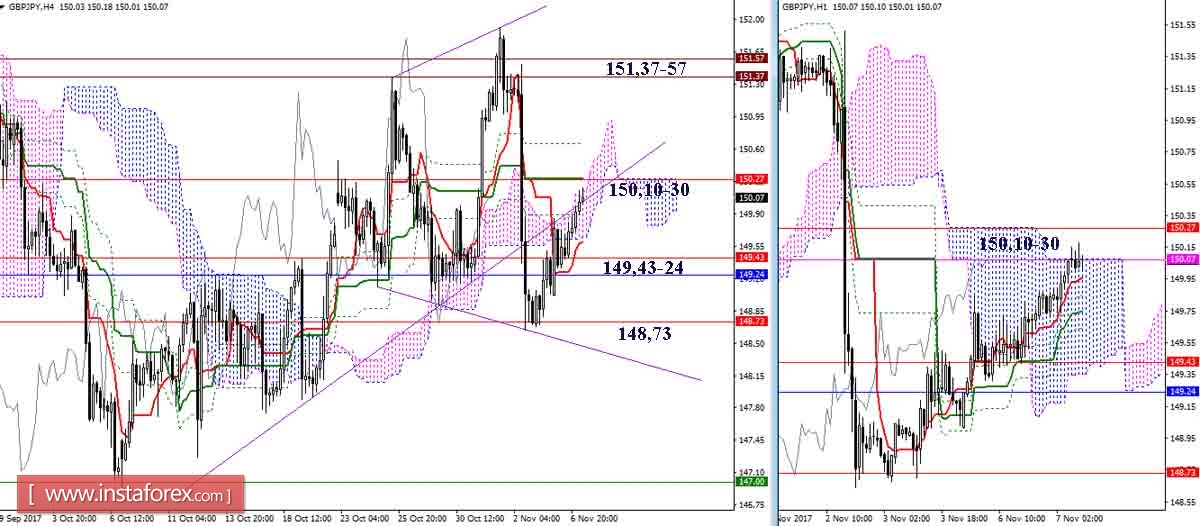
An upward correction led the pair through the most significant resistance at the 150.10-30 area (Kijun H4 + cloud H4 + Senkou Span B N1 + day Tenkan). This zone is also the center of the expanding formation, which can attract and delay the development of the situation. The following resistances are located in the 151.37-57 area (historical levels + target for breakdown of the H1 cloud), hence, the breakdown of the trend will be important. Supports for today should be noted at 149.43-24 (upper-tier levels + bottom of the H1 cloud) and 148.73 (daylight cloud).
EUR / JPY
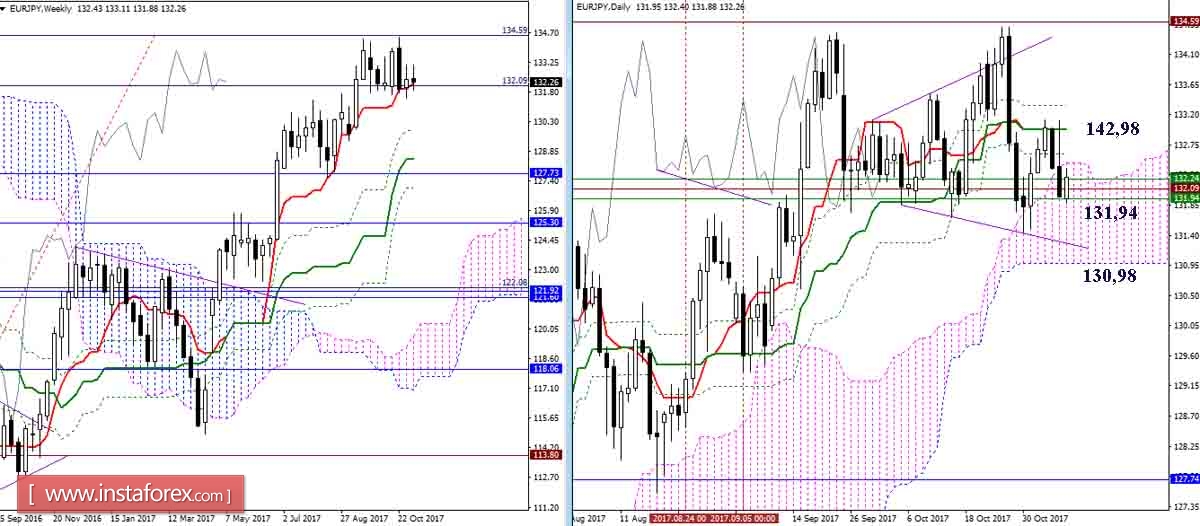
The resistance at the center of the expanding formation (142.98 day cross) did not allow players to increase the Balance of Power indicator in their favor. The pair returned to the support of the weekly Tenkan at the range 131.94-132.24, while entering the day's cloud. Overcoming the level open doors for the opportunity to continue the decline towards the nearest reference point, which is the daytime Senkou Span B at 130.98.
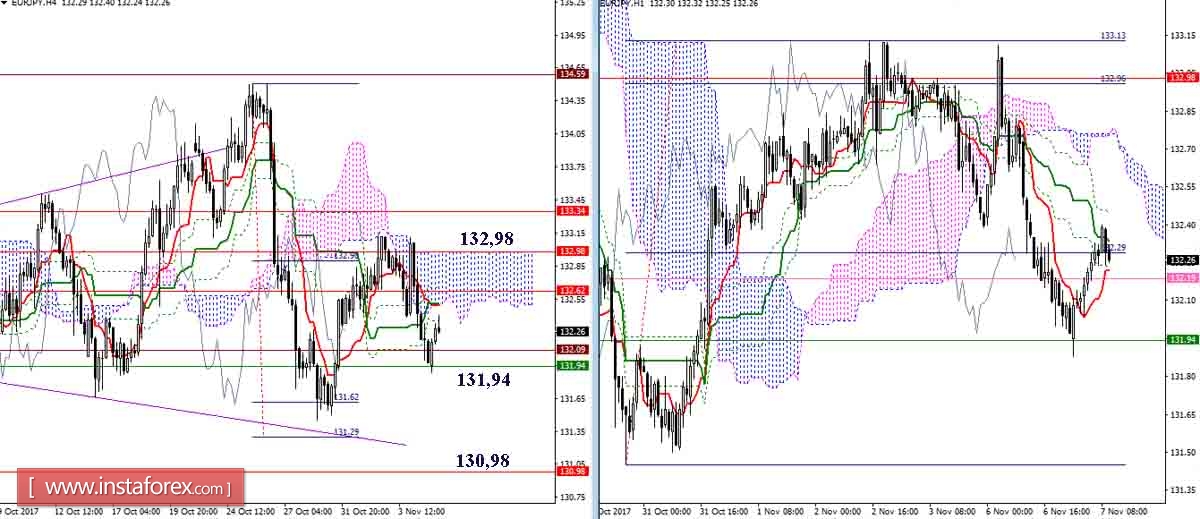
The major resistance zone at 132.62 - 132.98 - 133.34 has retained its position and significance. The breakdown and consolidation above create new prospects for players to raise. A position below this zone holds some advantage on the players' side of the slide. Overcoming support of 131.94 opens the way to the lower boundary of the daytime cloud (130.98).
Indicator parameters:
all time intervals 9 - 26 - 52
The color of indicator lines:
Tenkan (short-term trend) - red,
Kijun (medium-term trend) - green,
Fibo Kijun is a green dotted line,
Chinkou is gray,
clouds: Senkou Span B (SSB, long-term trend) - blue,
Senkou Span A (SSA) - pink.
The color of additional lines:
support and resistance MN - blue, W1 - green, D1 - red, H4 - pink, H1 - gray,
horizontal levels (not Ichimoku) - brown,
trend lines - purple.
* The presented market analysis is informative and does not constitute a guide to the transaction.