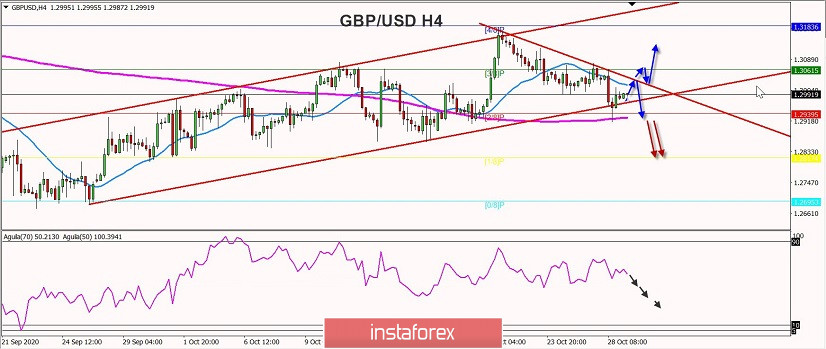
These days we have seen how the pound, due to the Brexit uncertainties, has been losing its apparent strength. So, GBP/USD declined sharply. On the macroeconomic front, in the next few hours the UK is due to release reports on net lending to individuals, M4 money supply, and mortgage approvals for September.
At a technical level, the GBP / USD pair is rebounding after having found support in the area of the 200-day moving average, and thus maintaining its medium-term uptrend channel. On the other hand, from the 1.3178 maximum, the 4/8 Murray area, the pair began to decline, drawing a bearish line. The pair has entered below the 21-day EMA or pressure line and the support of 2 / 8 of Murray now. We hope that ithe price will try to break the 1.3033 area. If it fails to break it, it would be a good option to sell below this level, up to the EMA of 200 and 2/8. If the pair consolidates above 1.3041, our target will be at 1.3116. On the other hand below the 200 average, there would be a sharp drop, thus losing the long-term trend line with targets at 1.2817 Murray reversal zone. The Eagle indicator is giving a bearish signal.

Our key levels are:
Buy above 1.3044 with take profit in 1.3108 resistance zones.
Sell if pullback to 1.3040 with target 1.2955 and sell below the 200 moving average, below 1.2926, with targets at 1.2827.
 English
 Русский
 Bahasa Indonesia
 Bahasa Malay
 ไทย
ไทย Español
 Deutsch
 Български
 Français
 Tiếng Việt
 中文
中文 বাংলা
বাংলা हिन्दी
 Čeština
 Українська
 Română

