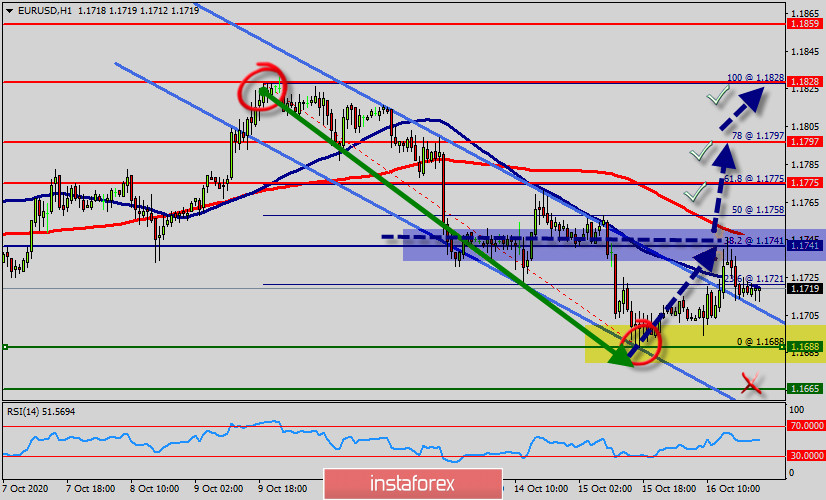
Last week, the EUR/USD pair ended the weekly session at 1.1719, in a area of a very strong mid-term support, which has stopped its decline many times over the past 5 days.
The EURUSD pair clears major supprt at 1.1688 levels over the past week. The structure remains constructive for a continued decline but an impulse looks to be complete. The saturation state is clear for the region of 1.1688.
The EURUSD pair dropped sharply from the level of 1.1828 towards 1.1688. Now, the price is set at 1.1741 to act as a weekly pivot point. It should be noted that volatility is very high for that the EURUSD pair is still moving between 1.1688 and 1.1797 in coming hours.
The EURUSD pair is expected to produce a corrective drop towards 1.1688 at least, before resuming its rally higher. It is not a certainty but probability remains high for a corrective drop before the rally could resume.
Price has dropped strongly after breaking our ascending support line and has reached our profit target perfectly. We prepare to buy on dips above the 1.1688 level (support) for a bounce up to at least 1.1741 resistance (38.2% Fibonacci retracement, pivot point).
We shall wait for a confirmation of a bullish reversal after breaking up the wekly pivot point of 1.1741.
Today, the EUR/USD pair will be prbably continuing to move upwards from the level of 1.1688. So, the pair will rebound from the bottom of 1.1688 in order to call for a strong bullish market this week.
The first support level is seen at 1.1688, the price is moving in a bullish channel now. Furthermore, the price has been setting above the strong support at the level of 1.1688.
This support (1.1688) has rejected several times confirming the veracity of an uptrend.
Additionally, RSI starts signaling an upward trend. RSI (14) sees major descending support line acting as support to push price up from the zone of 1.1688 - 1.1700.
As a result, if the EUR/USD pair is able to break out the first resistance at 1.1741, the market will rise further to 1.1775 so as to test the weekly resistance 2. Consequently, the market is likely to show signs of a bullish trend.
So, it will be good to buy above the level of 1.1688 with the first target at 1.1741 and further to 1.1775.
Since then, the currency has remained in control of bulls carving a series of higher lows and higher highs through 1.1775 handle. Also note that the above rally seems to be an impulse wave.
Moreover, Buy-deals are recommended above 1.1741 with the first target seen at 1.1775. The movement is likely to resume to the point 1.1797 and further to the point 1.1828.
However, The EURUSD pair rally could resume thereafter and head towards 1.1797 mark going further. Only a break below 1.1688 would change the above bullish structure.
Overall, we still prefer the bullish scenario which suggests that the pair will stay above the spot of 1.1688.
Conclusion :
The EUR/USD pair is continuing to move in a bullish trend from the new support level of 1.1688, to form a bullish channel. Amid the previous events, we expect the pair to move between 1.1688 and 1.1797. Therefore, buy above the level of 1.1688 with the first target at 1.1741 with a view to test the daily resistance 1 and further to 1.1775 then we will see new objectives of 1.1797 and 1.1828. Nevertheless, if the pair fails to pass through the level of 1.1741, the market will indicate a bearish opportunity below the level of 1.1741. The market will decline further to 1.1688.
 English
 Русский
 Bahasa Indonesia
 Bahasa Malay
 ไทย
ไทย Español
 Deutsch
 Български
 Français
 Tiếng Việt
 中文
中文 বাংলা
বাংলা हिन्दी
 Čeština
 Українська
 Română

