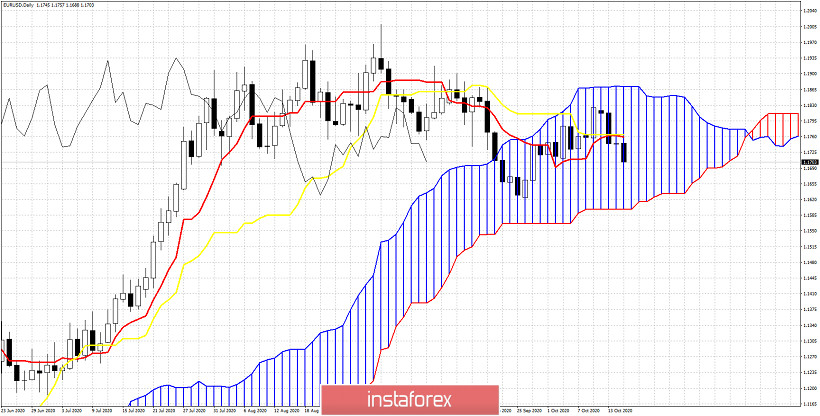
EURUSD as we explained in our previous analysis is in neutral trend as price is inside the Daily Kumo. However we also mentioned that price is vulnerable to a pull back and move lower as long as price is below both the tenkan-sen and kijun-sen.

Resistance is at 1.1765 where we find both the tenkan-sen (red line indicator) and the kijun-sen (yellow line indicator). Price is below this level and this is what makes us see thinks ready for a move lower towards the lower cloud boundary at 1.16. We warned bulls that entering the cloud and breaking below the tenkan-sen and kijun-sen would push price towards the lower cloud boundary. This is what is happening now. Bulls still have hopes as long as price is inside the cloud. Breaking out and below the cloud would be a very bearish sign for EURUSD.
 English
 Русский
 Bahasa Indonesia
 Bahasa Malay
 ไทย
ไทย Español
 Deutsch
 Български
 Français
 Tiếng Việt
 中文
中文 বাংলা
বাংলা हिन्दी
 Čeština
 Українська
 Română

