- Too early to say if ECB emergency support measures need to be extended
Knot may be a perennial hawk on the ECB board but the comments above pretty much reflects the wait-and-see approach the central bank is largely adopting currently.
Further Development

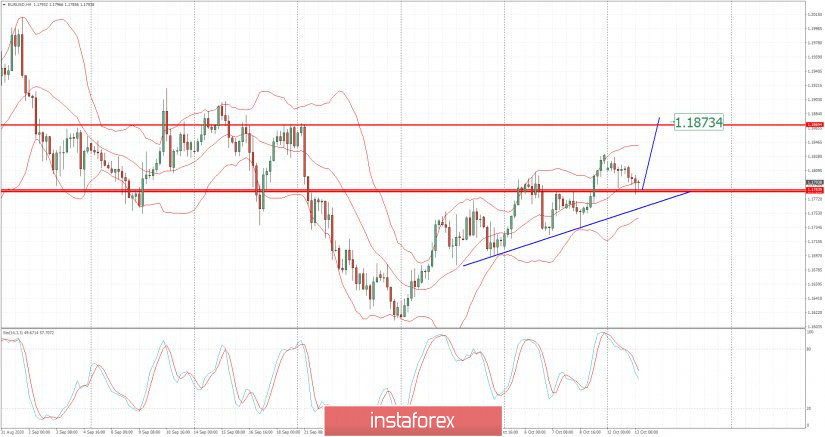
Analyzing the current trading chart of EUR. I found that there is completion of the downward correction (bull flag pattern), which is good indication for the further rise on the Gold.
Additionally, there is the test-reject of the middle Bollinger band, which is another confirmation for further rise....
My advice is to watch for buying opportunities with the targets at 1,1830 and 1,1875.
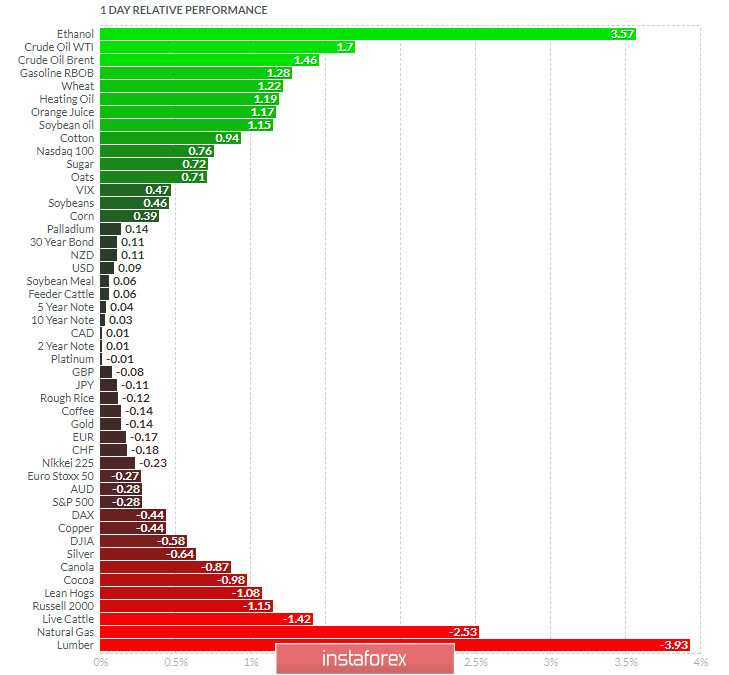
1-Day relative strength performance Finviz

Based on the graph above I found that on the top of the list we got Ethanol and Crude Oil today and on the bottom Lumber and Natural Gas.
EUR is slightly negative on the the list but with no evidence of any strong downside momentum.
Key Levels:
Resistance levels: 1,1830 and 1,1873
Support level: 1,1780
 English
 Русский
 Bahasa Indonesia
 Bahasa Malay
 ไทย
ไทย Español
 Deutsch
 Български
 Français
 Tiếng Việt
 中文
中文 বাংলা
বাংলা हिन्दी
 Čeština
 Українська
 Română

