He reinforces that there is 'strong' EU unity ahead of the European Council meeting later this week and that they will continue to work for a fair Brexit deal in the coming 'days and weeks'. I think the mention of 'weeks' says a lot about what they are expecting.

Further Development

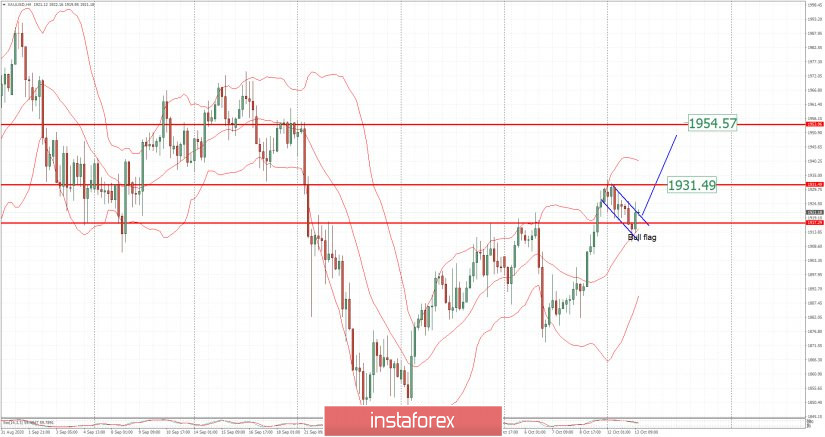
Analyzing the current trading chart of Gold, I found that there is completion of the downward correction (bull flag pattern), which is good indication for the further rise on the Gold.
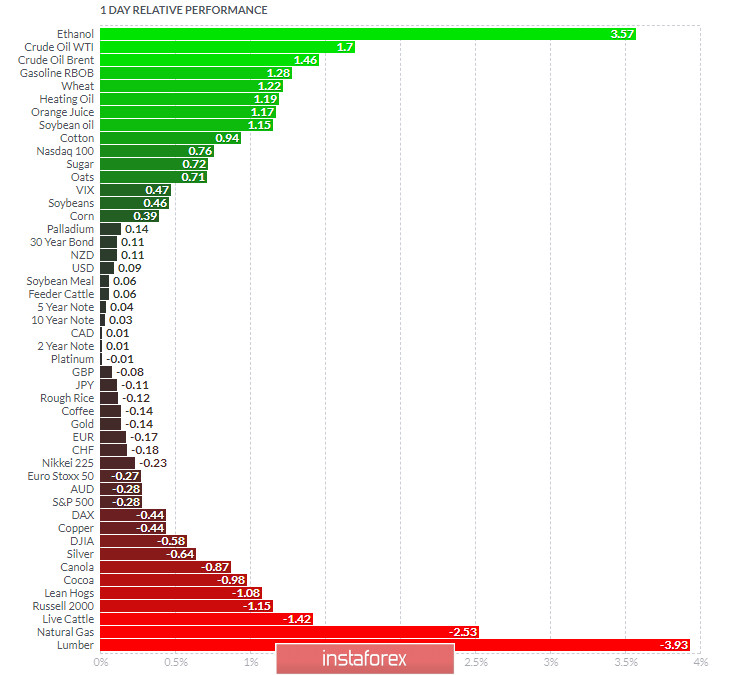
1-Day relative strength performance Finviz

Based on the graph above I found that on the top of the list we got Ethanol and Crude Oil today and on the bottom Lumber and Natural Gas.
Key Levels:
Resistance levels: $1,931 and $1,954
Support level: $1,910
 English
 Русский
 Bahasa Indonesia
 Bahasa Malay
 ไทย
ไทย Español
 Deutsch
 Български
 Français
 Tiếng Việt
 中文
中文 বাংলা
বাংলা हिन्दी
 Čeština
 Українська
 Română

