- Fundamentally : Coronavirus (COVID-19)
The Euro/US Dollar despite the high hopes of reaching the rescue package and the decline in demand for the Dollar since last week. However, the pair is still under pressure because of the health conditions in Europe. In a decline after the rise in injuries in important countries such as France and others. Moreover, we wait and expectation of Trump's case too!.
- Reason for the trading strategy (Technically) :
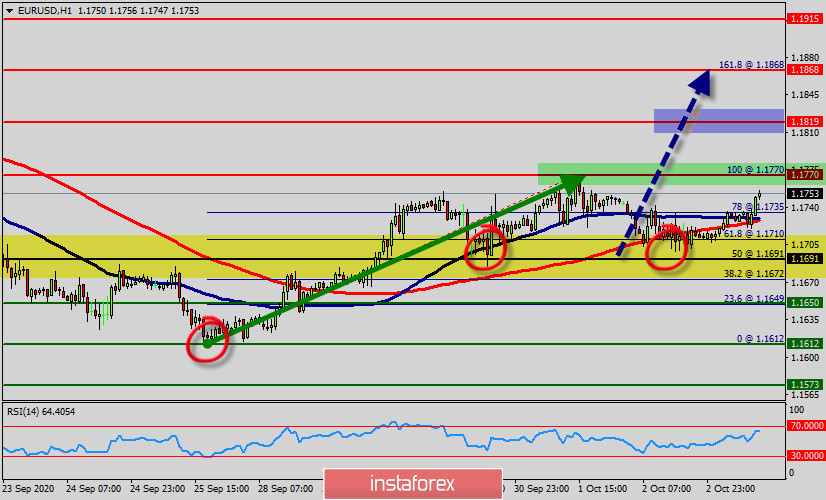
There is not any correction of the downward movement. The instrument is trading between the levels of 1.1691 and 1.1819.
The level of 1.1691 is expected to act as the major support today. We expect the EUR/USD pair to continue moving in the bullish trend towards the target level of 1.1770 so as to test the double top.
Note, the EUR/USD pair has climbed along a steep, upward-sloping support channel since last week, the pair rose at an even more ambitious incline in coming hours.
The RSI (14) sees major ascending support line acting as support to push price up from the 1.1691 level (61.8% Fibonacci).
Today, the level of 1.1691 represents a daily support in the H1 time frame. The pair has already formed the minor resistance at 1.1770 and the strong resistance is seen at the level of 1.1819 as it represents the weekly resistance 1.
So, the major resistance is seen at 1.1819, while immediate support is found at 1.1691. If the pair closes above the weekly pivot point of 1.1691, the EUR/USD pair may resume its movement to 1.1819 to test the weekly resistance 1.
From this point, we expect the EUR/USD pair to move between the levels of 1.1691 and 1.1819. Equally important, the Moving average (100) is still calling for a strong bullish market because the current price is above the moving average 100 and 50.
As a result, buy above the level of 1.1691 with targets at 1.1770 and 1.1819. On the other hand, stop loss should always be taken into account; accordingly, it will be beneficial to set the stop loss below the last bearish wave at the level of 1.1650.
Analysis tip:
- If the trend is be able to hit the daily pivot point (because of a market bounce in next day), it will of the wisdom to sell as the we did on the weekly strategy. Sometimes, it uses in a daily trade to stop long position and open a new short position. It should be noted that we combine the daily pivot point, weekly pivot point strategies and sentiment analysis to trade.
 English
 Русский
 Bahasa Indonesia
 Bahasa Malay
 ไทย
ไทย Español
 Deutsch
 Български
 Français
 Tiếng Việt
 中文
中文 বাংলা
বাংলা हिन्दी
 Čeština
 Українська
 Română

